Immigrants from Croatia vs British West Indian Single Mother Households
COMPARE
Immigrants from Croatia
British West Indian
Single Mother Households
Single Mother Households Comparison
Immigrants from Croatia
British West Indians
5.4%
SINGLE MOTHER HOUSEHOLDS
99.4/ 100
METRIC RATING
45th/ 347
METRIC RANK
8.4%
SINGLE MOTHER HOUSEHOLDS
0.0/ 100
METRIC RATING
326th/ 347
METRIC RANK
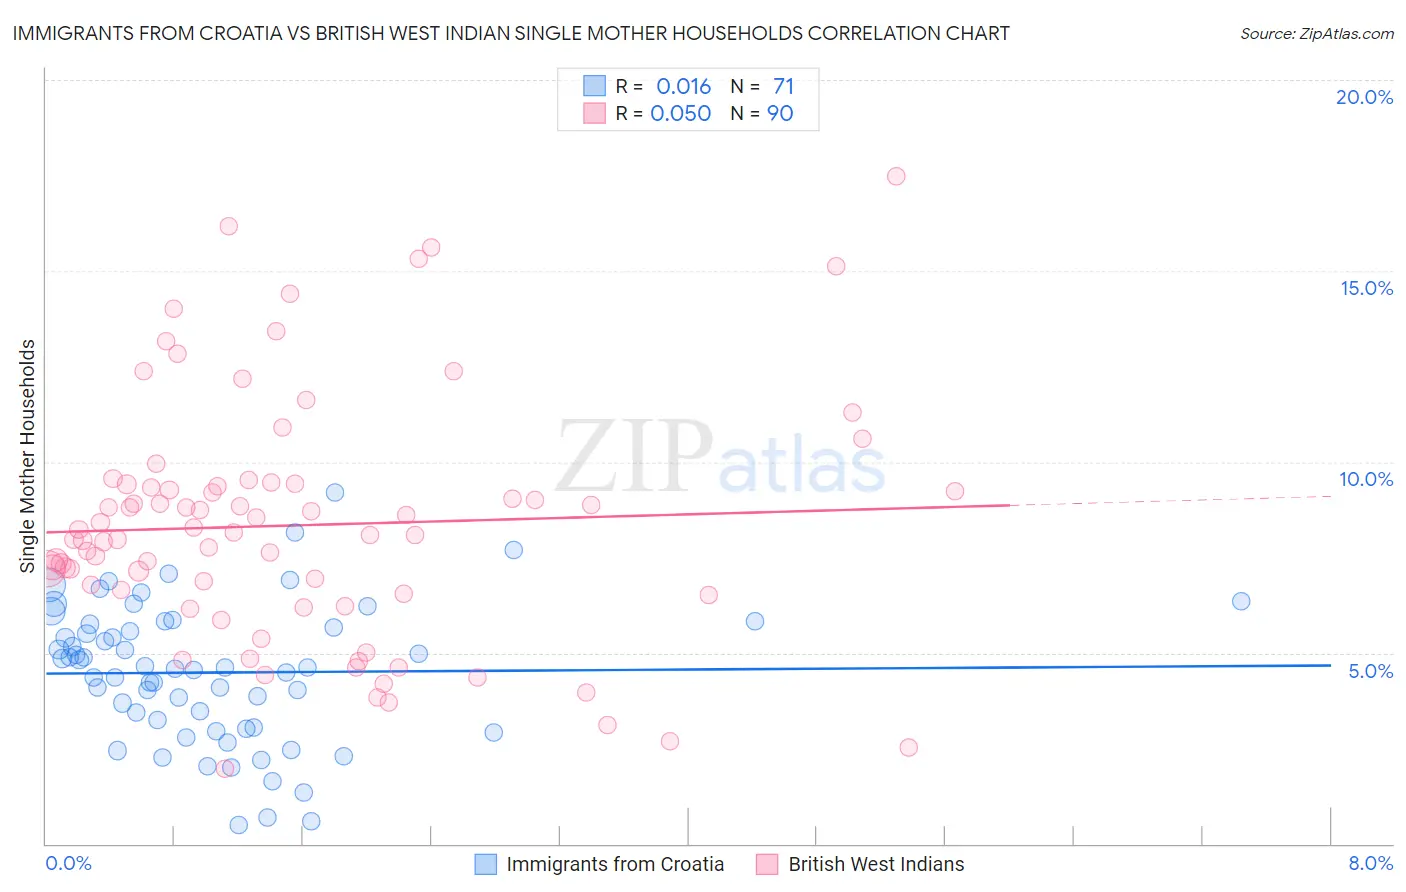
Immigrants from Croatia vs British West Indian Single Mother Households Correlation Chart
The statistical analysis conducted on geographies consisting of 132,474,478 people shows no correlation between the proportion of Immigrants from Croatia and percentage of single mother households in the United States with a correlation coefficient (R) of 0.016 and weighted average of 5.4%. Similarly, the statistical analysis conducted on geographies consisting of 152,574,422 people shows no correlation between the proportion of British West Indians and percentage of single mother households in the United States with a correlation coefficient (R) of 0.050 and weighted average of 8.4%, a difference of 54.1%.
Single Mother Households Correlation Summary
| Measurement | Immigrants from Croatia | British West Indian |
| Minimum | 0.49% | 2.0% |
| Maximum | 9.2% | 17.5% |
| Range | 8.7% | 15.5% |
| Mean | 4.5% | 8.3% |
| Median | 4.6% | 8.1% |
| Interquartile 25% (IQ1) | 3.0% | 6.5% |
| Interquartile 75% (IQ3) | 5.7% | 9.4% |
| Interquartile Range (IQR) | 2.7% | 2.9% |
| Standard Deviation (Sample) | 1.8% | 3.2% |
| Standard Deviation (Population) | 1.8% | 3.2% |
Similar Demographics by Single Mother Households
Demographics Similar to Immigrants from Croatia by Single Mother Households
In terms of single mother households, the demographic groups most similar to Immigrants from Croatia are Lithuanian (5.4%, a difference of 0.12%), Croatian (5.5%, a difference of 0.26%), Norwegian (5.5%, a difference of 0.44%), Turkish (5.5%, a difference of 0.64%), and Immigrants from Latvia (5.5%, a difference of 0.67%).
| Demographics | Rating | Rank | Single Mother Households |
| Immigrants | Serbia | 99.6 /100 | #38 | Exceptional 5.4% |
| Immigrants | Sweden | 99.6 /100 | #39 | Exceptional 5.4% |
| Estonians | 99.6 /100 | #40 | Exceptional 5.4% |
| Immigrants | Greece | 99.5 /100 | #41 | Exceptional 5.4% |
| Macedonians | 99.5 /100 | #42 | Exceptional 5.4% |
| Immigrants | South Central Asia | 99.5 /100 | #43 | Exceptional 5.4% |
| Lithuanians | 99.4 /100 | #44 | Exceptional 5.4% |
| Immigrants | Croatia | 99.4 /100 | #45 | Exceptional 5.4% |
| Croatians | 99.3 /100 | #46 | Exceptional 5.5% |
| Norwegians | 99.3 /100 | #47 | Exceptional 5.5% |
| Turks | 99.2 /100 | #48 | Exceptional 5.5% |
| Immigrants | Latvia | 99.2 /100 | #49 | Exceptional 5.5% |
| Immigrants | Scotland | 99.2 /100 | #50 | Exceptional 5.5% |
| Immigrants | Belarus | 99.2 /100 | #51 | Exceptional 5.5% |
| Swedes | 99.1 /100 | #52 | Exceptional 5.5% |
Demographics Similar to British West Indians by Single Mother Households
In terms of single mother households, the demographic groups most similar to British West Indians are Immigrants from Caribbean (8.4%, a difference of 0.12%), Immigrants from Haiti (8.4%, a difference of 0.15%), Immigrants from Jamaica (8.4%, a difference of 0.31%), Yakama (8.4%, a difference of 0.32%), and Haitian (8.3%, a difference of 0.74%).
| Demographics | Rating | Rank | Single Mother Households |
| Jamaicans | 0.0 /100 | #319 | Tragic 8.2% |
| Bahamians | 0.0 /100 | #320 | Tragic 8.3% |
| Immigrants | Senegal | 0.0 /100 | #321 | Tragic 8.3% |
| Pima | 0.0 /100 | #322 | Tragic 8.3% |
| Haitians | 0.0 /100 | #323 | Tragic 8.3% |
| Immigrants | Jamaica | 0.0 /100 | #324 | Tragic 8.4% |
| Immigrants | Caribbean | 0.0 /100 | #325 | Tragic 8.4% |
| British West Indians | 0.0 /100 | #326 | Tragic 8.4% |
| Immigrants | Haiti | 0.0 /100 | #327 | Tragic 8.4% |
| Yakama | 0.0 /100 | #328 | Tragic 8.4% |
| Hopi | 0.0 /100 | #329 | Tragic 8.5% |
| Inupiat | 0.0 /100 | #330 | Tragic 8.5% |
| Sioux | 0.0 /100 | #331 | Tragic 8.5% |
| U.S. Virgin Islanders | 0.0 /100 | #332 | Tragic 8.6% |
| Liberians | 0.0 /100 | #333 | Tragic 8.6% |