Samoan vs British West Indian 10th Grade
COMPARE
Samoan
British West Indian
10th Grade
10th Grade Comparison
Samoans
British West Indians
93.4%
10TH GRADE
19.5/ 100
METRIC RATING
207th/ 347
METRIC RANK
91.8%
10TH GRADE
0.0/ 100
METRIC RATING
290th/ 347
METRIC RANK
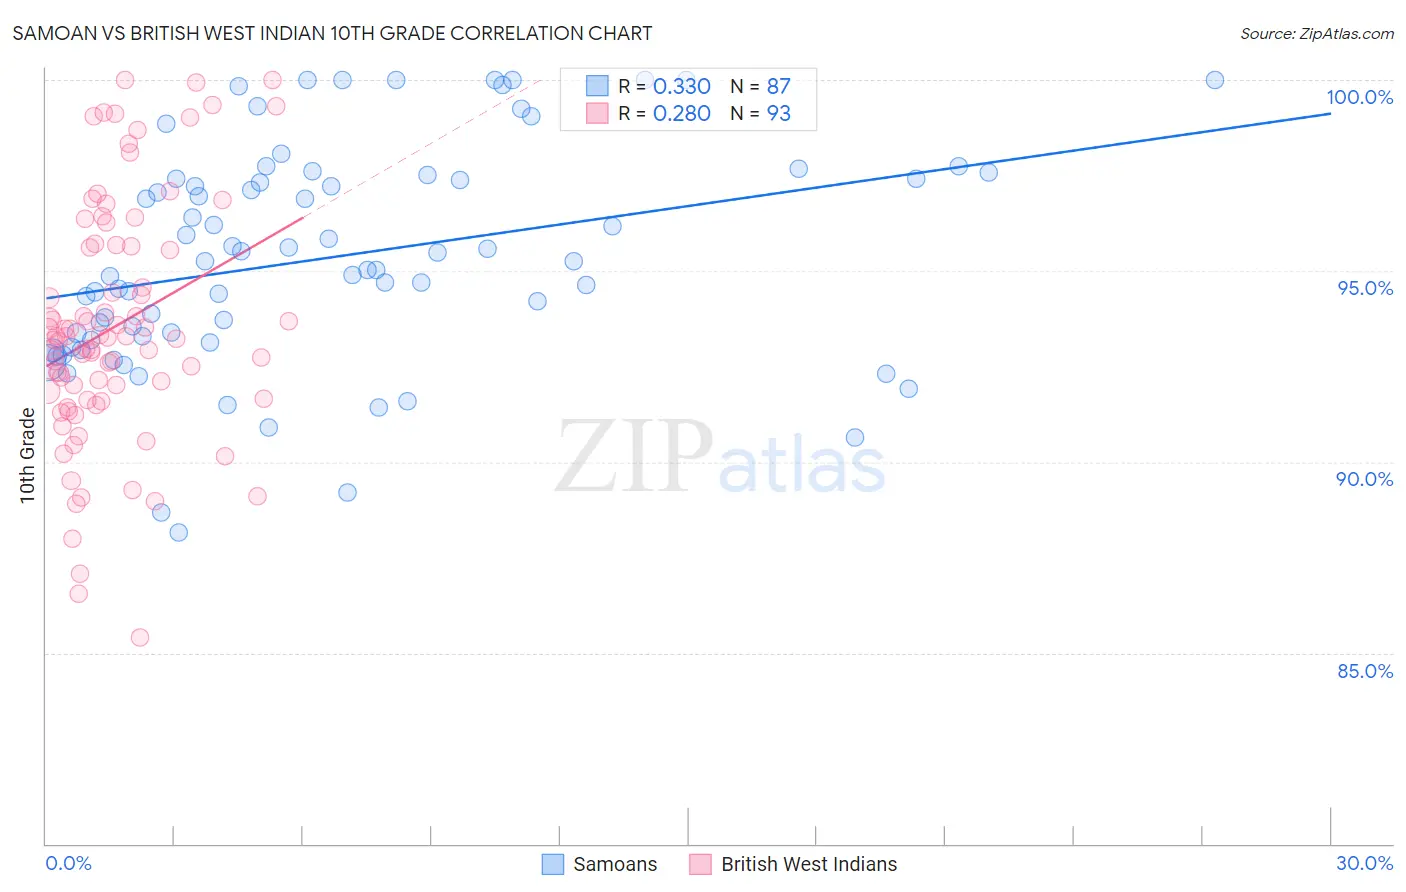
Samoan vs British West Indian 10th Grade Correlation Chart
The statistical analysis conducted on geographies consisting of 225,201,909 people shows a mild positive correlation between the proportion of Samoans and percentage of population with at least 10th grade education in the United States with a correlation coefficient (R) of 0.330 and weighted average of 93.4%. Similarly, the statistical analysis conducted on geographies consisting of 152,698,597 people shows a weak positive correlation between the proportion of British West Indians and percentage of population with at least 10th grade education in the United States with a correlation coefficient (R) of 0.280 and weighted average of 91.8%, a difference of 1.8%.
10th Grade Correlation Summary
| Measurement | Samoan | British West Indian |
| Minimum | 88.1% | 85.4% |
| Maximum | 100.0% | 100.0% |
| Range | 11.9% | 14.6% |
| Mean | 95.4% | 93.5% |
| Median | 95.2% | 93.2% |
| Interquartile 25% (IQ1) | 93.2% | 91.6% |
| Interquartile 75% (IQ3) | 97.4% | 95.7% |
| Interquartile Range (IQR) | 4.2% | 4.0% |
| Standard Deviation (Sample) | 2.9% | 3.2% |
| Standard Deviation (Population) | 2.8% | 3.1% |
Similar Demographics by 10th Grade
Demographics Similar to Samoans by 10th Grade
In terms of 10th grade, the demographic groups most similar to Samoans are Immigrants from Syria (93.4%, a difference of 0.0%), Immigrants from Western Asia (93.4%, a difference of 0.010%), Ute (93.4%, a difference of 0.010%), Immigrants from Indonesia (93.4%, a difference of 0.010%), and Immigrants from Sudan (93.4%, a difference of 0.010%).
| Demographics | Rating | Rank | 10th Grade |
| Hopi | 22.2 /100 | #200 | Fair 93.5% |
| Hawaiians | 21.8 /100 | #201 | Fair 93.5% |
| Immigrants | Uganda | 20.9 /100 | #202 | Fair 93.5% |
| Immigrants | Western Asia | 20.6 /100 | #203 | Fair 93.4% |
| Ute | 20.3 /100 | #204 | Fair 93.4% |
| Immigrants | Indonesia | 20.2 /100 | #205 | Fair 93.4% |
| Immigrants | Sudan | 20.0 /100 | #206 | Fair 93.4% |
| Samoans | 19.5 /100 | #207 | Poor 93.4% |
| Immigrants | Syria | 19.4 /100 | #208 | Poor 93.4% |
| Immigrants | Chile | 18.8 /100 | #209 | Poor 93.4% |
| Indians (Asian) | 17.6 /100 | #210 | Poor 93.4% |
| Cajuns | 16.9 /100 | #211 | Poor 93.4% |
| Immigrants | Zaire | 16.7 /100 | #212 | Poor 93.4% |
| Immigrants | Asia | 15.7 /100 | #213 | Poor 93.4% |
| Immigrants | Bahamas | 15.2 /100 | #214 | Poor 93.4% |
Demographics Similar to British West Indians by 10th Grade
In terms of 10th grade, the demographic groups most similar to British West Indians are Immigrants from West Indies (91.8%, a difference of 0.0%), Immigrants from Burma/Myanmar (91.8%, a difference of 0.010%), Sri Lankan (91.8%, a difference of 0.020%), Indonesian (91.8%, a difference of 0.030%), and Pennsylvania German (91.9%, a difference of 0.060%).
| Demographics | Rating | Rank | 10th Grade |
| Immigrants | St. Vincent and the Grenadines | 0.0 /100 | #283 | Tragic 92.1% |
| Immigrants | Barbados | 0.0 /100 | #284 | Tragic 92.1% |
| Immigrants | South Eastern Asia | 0.0 /100 | #285 | Tragic 92.1% |
| Yuman | 0.0 /100 | #286 | Tragic 92.0% |
| Pennsylvania Germans | 0.0 /100 | #287 | Tragic 91.9% |
| Immigrants | Laos | 0.0 /100 | #288 | Tragic 91.9% |
| Sri Lankans | 0.0 /100 | #289 | Tragic 91.8% |
| British West Indians | 0.0 /100 | #290 | Tragic 91.8% |
| Immigrants | West Indies | 0.0 /100 | #291 | Tragic 91.8% |
| Immigrants | Burma/Myanmar | 0.0 /100 | #292 | Tragic 91.8% |
| Indonesians | 0.0 /100 | #293 | Tragic 91.8% |
| Haitians | 0.0 /100 | #294 | Tragic 91.8% |
| Lumbee | 0.0 /100 | #295 | Tragic 91.7% |
| Immigrants | Grenada | 0.0 /100 | #296 | Tragic 91.6% |
| Fijians | 0.0 /100 | #297 | Tragic 91.5% |