U.S. Virgin Islander vs British West Indian Single Mother Households
COMPARE
U.S. Virgin Islander
British West Indian
Single Mother Households
Single Mother Households Comparison
U.S. Virgin Islanders
British West Indians
8.6%
SINGLE MOTHER HOUSEHOLDS
0.0/ 100
METRIC RATING
332nd/ 347
METRIC RANK
8.4%
SINGLE MOTHER HOUSEHOLDS
0.0/ 100
METRIC RATING
326th/ 347
METRIC RANK
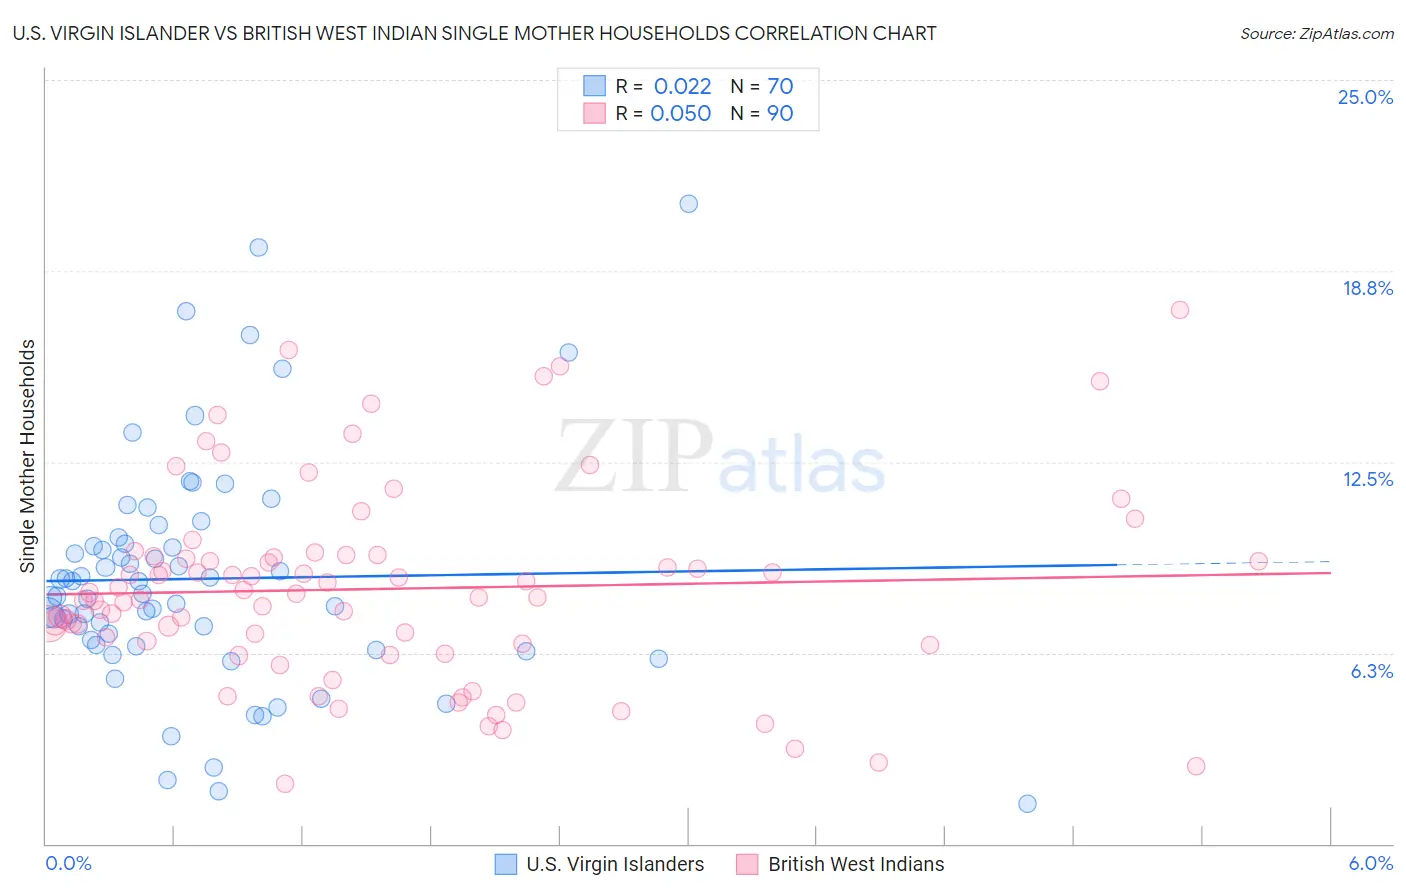
U.S. Virgin Islander vs British West Indian Single Mother Households Correlation Chart
The statistical analysis conducted on geographies consisting of 87,484,063 people shows no correlation between the proportion of U.S. Virgin Islanders and percentage of single mother households in the United States with a correlation coefficient (R) of 0.022 and weighted average of 8.6%. Similarly, the statistical analysis conducted on geographies consisting of 152,574,422 people shows no correlation between the proportion of British West Indians and percentage of single mother households in the United States with a correlation coefficient (R) of 0.050 and weighted average of 8.4%, a difference of 2.7%.
Single Mother Households Correlation Summary
| Measurement | U.S. Virgin Islander | British West Indian |
| Minimum | 1.3% | 2.0% |
| Maximum | 21.0% | 17.5% |
| Range | 19.7% | 15.5% |
| Mean | 8.7% | 8.3% |
| Median | 8.1% | 8.1% |
| Interquartile 25% (IQ1) | 6.5% | 6.5% |
| Interquartile 75% (IQ3) | 9.8% | 9.4% |
| Interquartile Range (IQR) | 3.3% | 2.9% |
| Standard Deviation (Sample) | 3.8% | 3.2% |
| Standard Deviation (Population) | 3.8% | 3.2% |
Demographics Similar to U.S. Virgin Islanders and British West Indians by Single Mother Households
In terms of single mother households, the demographic groups most similar to U.S. Virgin Islanders are Liberian (8.6%, a difference of 0.33%), Immigrants from Liberia (8.7%, a difference of 1.1%), Immigrants from Dominica (8.7%, a difference of 1.4%), Puerto Rican (8.7%, a difference of 1.5%), and Inupiat (8.5%, a difference of 1.5%). Similarly, the demographic groups most similar to British West Indians are Immigrants from Caribbean (8.4%, a difference of 0.12%), Immigrants from Haiti (8.4%, a difference of 0.15%), Immigrants from Jamaica (8.4%, a difference of 0.31%), Yakama (8.4%, a difference of 0.32%), and Haitian (8.3%, a difference of 0.74%).
| Demographics | Rating | Rank | Single Mother Households |
| Jamaicans | 0.0 /100 | #319 | Tragic 8.2% |
| Bahamians | 0.0 /100 | #320 | Tragic 8.3% |
| Immigrants | Senegal | 0.0 /100 | #321 | Tragic 8.3% |
| Pima | 0.0 /100 | #322 | Tragic 8.3% |
| Haitians | 0.0 /100 | #323 | Tragic 8.3% |
| Immigrants | Jamaica | 0.0 /100 | #324 | Tragic 8.4% |
| Immigrants | Caribbean | 0.0 /100 | #325 | Tragic 8.4% |
| British West Indians | 0.0 /100 | #326 | Tragic 8.4% |
| Immigrants | Haiti | 0.0 /100 | #327 | Tragic 8.4% |
| Yakama | 0.0 /100 | #328 | Tragic 8.4% |
| Hopi | 0.0 /100 | #329 | Tragic 8.5% |
| Inupiat | 0.0 /100 | #330 | Tragic 8.5% |
| Sioux | 0.0 /100 | #331 | Tragic 8.5% |
| U.S. Virgin Islanders | 0.0 /100 | #332 | Tragic 8.6% |
| Liberians | 0.0 /100 | #333 | Tragic 8.6% |
| Immigrants | Liberia | 0.0 /100 | #334 | Tragic 8.7% |
| Immigrants | Dominica | 0.0 /100 | #335 | Tragic 8.7% |
| Puerto Ricans | 0.0 /100 | #336 | Tragic 8.7% |
| Navajo | 0.0 /100 | #337 | Tragic 8.8% |
| Cape Verdeans | 0.0 /100 | #338 | Tragic 8.9% |
| Blacks/African Americans | 0.0 /100 | #339 | Tragic 9.0% |