Immigrants from Belarus vs U.S. Virgin Islander Single Father Households
COMPARE
Immigrants from Belarus
U.S. Virgin Islander
Single Father Households
Single Father Households Comparison
Immigrants from Belarus
U.S. Virgin Islanders
1.9%
SINGLE FATHER HOUSEHOLDS
100.0/ 100
METRIC RATING
11th/ 347
METRIC RANK
2.4%
SINGLE FATHER HOUSEHOLDS
31.8/ 100
METRIC RATING
189th/ 347
METRIC RANK
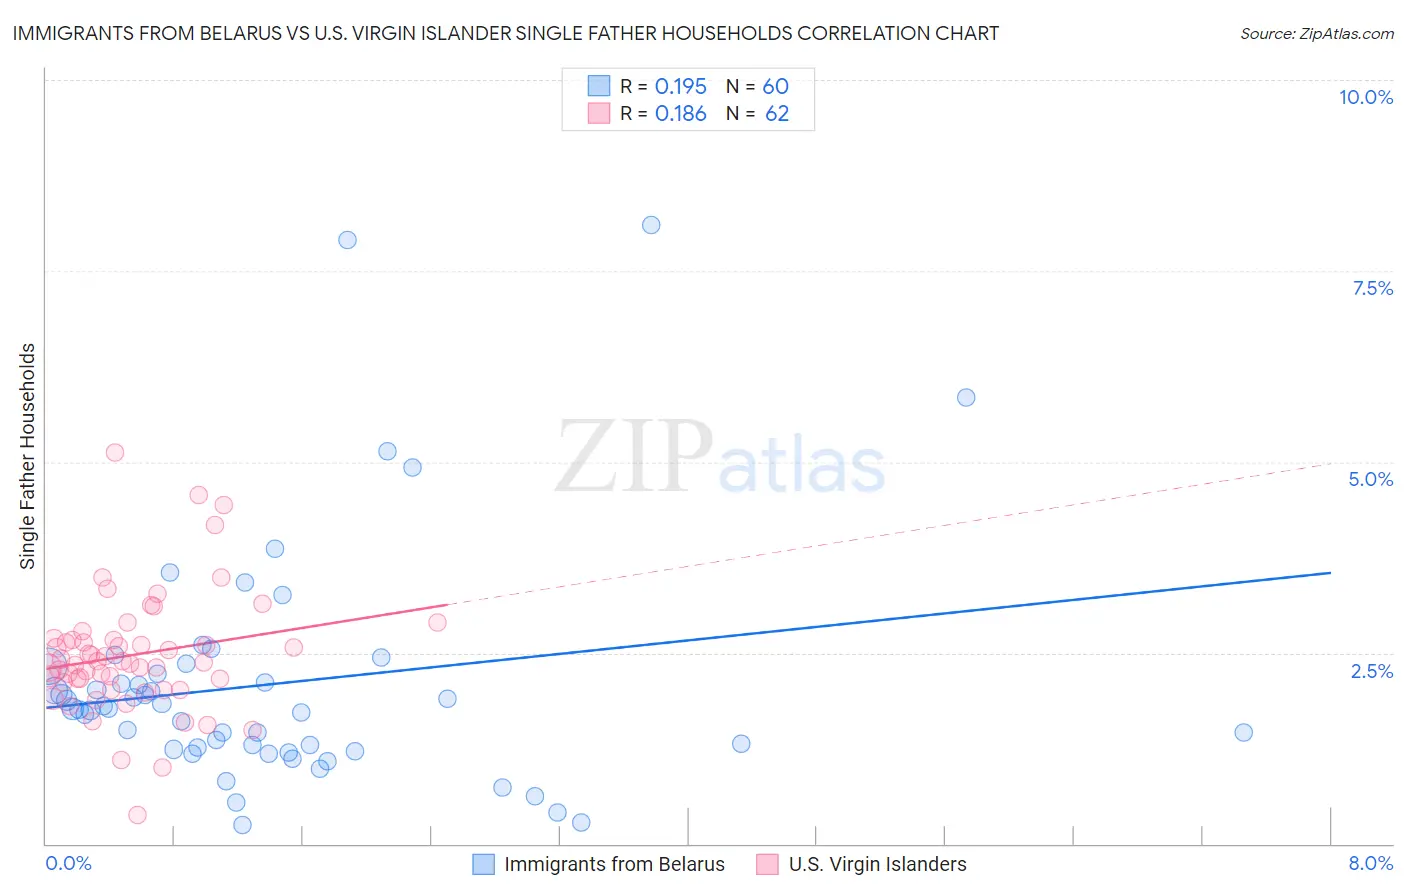
Immigrants from Belarus vs U.S. Virgin Islander Single Father Households Correlation Chart
The statistical analysis conducted on geographies consisting of 149,894,019 people shows a poor positive correlation between the proportion of Immigrants from Belarus and percentage of single father households in the United States with a correlation coefficient (R) of 0.195 and weighted average of 1.9%. Similarly, the statistical analysis conducted on geographies consisting of 87,373,145 people shows a poor positive correlation between the proportion of U.S. Virgin Islanders and percentage of single father households in the United States with a correlation coefficient (R) of 0.186 and weighted average of 2.4%, a difference of 27.6%.
Single Father Households Correlation Summary
| Measurement | Immigrants from Belarus | U.S. Virgin Islander |
| Minimum | 0.25% | 0.38% |
| Maximum | 8.1% | 5.1% |
| Range | 7.9% | 4.7% |
| Mean | 2.1% | 2.5% |
| Median | 1.8% | 2.4% |
| Interquartile 25% (IQ1) | 1.2% | 2.1% |
| Interquartile 75% (IQ3) | 2.3% | 2.7% |
| Interquartile Range (IQR) | 1.0% | 0.57% |
| Standard Deviation (Sample) | 1.5% | 0.80% |
| Standard Deviation (Population) | 1.5% | 0.79% |
Similar Demographics by Single Father Households
Demographics Similar to Immigrants from Belarus by Single Father Households
In terms of single father households, the demographic groups most similar to Immigrants from Belarus are Okinawan (1.9%, a difference of 0.32%), Immigrants from Greece (1.9%, a difference of 0.44%), Immigrants from Singapore (1.9%, a difference of 0.47%), Immigrants from China (1.8%, a difference of 0.68%), and Immigrants from Ireland (1.8%, a difference of 0.82%).
| Demographics | Rating | Rank | Single Father Households |
| Immigrants | Uzbekistan | 100.0 /100 | #4 | Exceptional 1.8% |
| Immigrants | Hong Kong | 100.0 /100 | #5 | Exceptional 1.8% |
| Immigrants | Taiwan | 100.0 /100 | #6 | Exceptional 1.8% |
| Cypriots | 100.0 /100 | #7 | Exceptional 1.8% |
| Immigrants | Ireland | 100.0 /100 | #8 | Exceptional 1.8% |
| Immigrants | China | 100.0 /100 | #9 | Exceptional 1.8% |
| Okinawans | 100.0 /100 | #10 | Exceptional 1.9% |
| Immigrants | Belarus | 100.0 /100 | #11 | Exceptional 1.9% |
| Immigrants | Greece | 100.0 /100 | #12 | Exceptional 1.9% |
| Immigrants | Singapore | 100.0 /100 | #13 | Exceptional 1.9% |
| Immigrants | Lithuania | 100.0 /100 | #14 | Exceptional 1.9% |
| Immigrants | Eastern Asia | 100.0 /100 | #15 | Exceptional 1.9% |
| Immigrants | Iran | 100.0 /100 | #16 | Exceptional 1.9% |
| Immigrants | India | 100.0 /100 | #17 | Exceptional 1.9% |
| Indians (Asian) | 100.0 /100 | #18 | Exceptional 1.9% |
Demographics Similar to U.S. Virgin Islanders by Single Father Households
In terms of single father households, the demographic groups most similar to U.S. Virgin Islanders are French (2.4%, a difference of 0.0%), Hmong (2.4%, a difference of 0.10%), Immigrants from Africa (2.4%, a difference of 0.15%), Immigrants from Sudan (2.4%, a difference of 0.17%), and Immigrants from Colombia (2.4%, a difference of 0.18%).
| Demographics | Rating | Rank | Single Father Households |
| Belgians | 43.3 /100 | #182 | Average 2.3% |
| Immigrants | Panama | 41.8 /100 | #183 | Average 2.4% |
| Sri Lankans | 41.8 /100 | #184 | Average 2.4% |
| Nigerians | 41.0 /100 | #185 | Average 2.4% |
| Immigrants | Bosnia and Herzegovina | 40.4 /100 | #186 | Average 2.4% |
| Immigrants | Colombia | 34.0 /100 | #187 | Fair 2.4% |
| Hmong | 33.0 /100 | #188 | Fair 2.4% |
| U.S. Virgin Islanders | 31.8 /100 | #189 | Fair 2.4% |
| French | 31.7 /100 | #190 | Fair 2.4% |
| Immigrants | Africa | 30.0 /100 | #191 | Fair 2.4% |
| Immigrants | Sudan | 29.8 /100 | #192 | Fair 2.4% |
| Uruguayans | 29.7 /100 | #193 | Fair 2.4% |
| Panamanians | 29.6 /100 | #194 | Fair 2.4% |
| Immigrants | Philippines | 28.7 /100 | #195 | Fair 2.4% |
| Kenyans | 28.0 /100 | #196 | Fair 2.4% |