Sioux vs U.S. Virgin Islander Single Father Households
COMPARE
Sioux
U.S. Virgin Islander
Single Father Households
Single Father Households Comparison
Sioux
U.S. Virgin Islanders
3.3%
SINGLE FATHER HOUSEHOLDS
0.0/ 100
METRIC RATING
338th/ 347
METRIC RANK
2.4%
SINGLE FATHER HOUSEHOLDS
31.8/ 100
METRIC RATING
189th/ 347
METRIC RANK
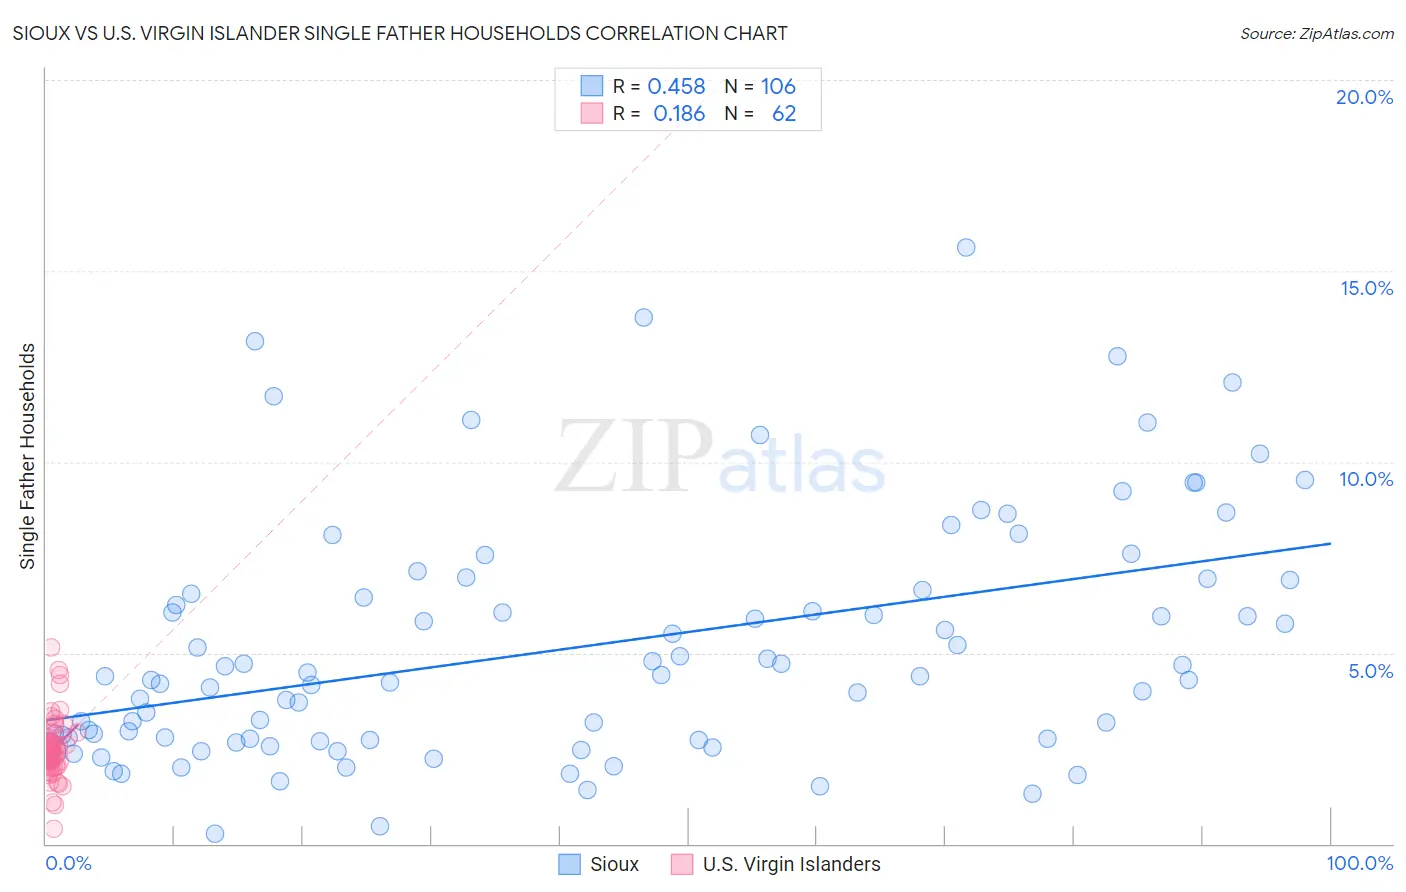
Sioux vs U.S. Virgin Islander Single Father Households Correlation Chart
The statistical analysis conducted on geographies consisting of 233,030,014 people shows a moderate positive correlation between the proportion of Sioux and percentage of single father households in the United States with a correlation coefficient (R) of 0.458 and weighted average of 3.3%. Similarly, the statistical analysis conducted on geographies consisting of 87,373,145 people shows a poor positive correlation between the proportion of U.S. Virgin Islanders and percentage of single father households in the United States with a correlation coefficient (R) of 0.186 and weighted average of 2.4%, a difference of 40.3%.
Single Father Households Correlation Summary
| Measurement | Sioux | U.S. Virgin Islander |
| Minimum | 0.25% | 0.38% |
| Maximum | 15.6% | 5.1% |
| Range | 15.4% | 4.7% |
| Mean | 5.2% | 2.5% |
| Median | 4.4% | 2.4% |
| Interquartile 25% (IQ1) | 2.7% | 2.1% |
| Interquartile 75% (IQ3) | 6.7% | 2.7% |
| Interquartile Range (IQR) | 3.9% | 0.57% |
| Standard Deviation (Sample) | 3.2% | 0.80% |
| Standard Deviation (Population) | 3.2% | 0.79% |
Similar Demographics by Single Father Households
Demographics Similar to Sioux by Single Father Households
In terms of single father households, the demographic groups most similar to Sioux are Pueblo (3.3%, a difference of 0.68%), Paiute (3.3%, a difference of 0.94%), Colville (3.3%, a difference of 0.96%), Yuman (3.3%, a difference of 0.98%), and Alaskan Athabascan (3.4%, a difference of 1.5%).
| Demographics | Rating | Rank | Single Father Households |
| Navajo | 0.0 /100 | #331 | Tragic 3.2% |
| Yaqui | 0.0 /100 | #332 | Tragic 3.2% |
| Natives/Alaskans | 0.0 /100 | #333 | Tragic 3.2% |
| Yuman | 0.0 /100 | #334 | Tragic 3.3% |
| Colville | 0.0 /100 | #335 | Tragic 3.3% |
| Paiute | 0.0 /100 | #336 | Tragic 3.3% |
| Pueblo | 0.0 /100 | #337 | Tragic 3.3% |
| Sioux | 0.0 /100 | #338 | Tragic 3.3% |
| Alaskan Athabascans | 0.0 /100 | #339 | Tragic 3.4% |
| Alaska Natives | 0.0 /100 | #340 | Tragic 3.5% |
| Crow | 0.0 /100 | #341 | Tragic 3.5% |
| Tohono O'odham | 0.0 /100 | #342 | Tragic 3.8% |
| Pima | 0.0 /100 | #343 | Tragic 4.2% |
| Yakama | 0.0 /100 | #344 | Tragic 4.2% |
| Menominee | 0.0 /100 | #345 | Tragic 4.2% |
Demographics Similar to U.S. Virgin Islanders by Single Father Households
In terms of single father households, the demographic groups most similar to U.S. Virgin Islanders are French (2.4%, a difference of 0.0%), Hmong (2.4%, a difference of 0.10%), Immigrants from Africa (2.4%, a difference of 0.15%), Immigrants from Sudan (2.4%, a difference of 0.17%), and Immigrants from Colombia (2.4%, a difference of 0.18%).
| Demographics | Rating | Rank | Single Father Households |
| Belgians | 43.3 /100 | #182 | Average 2.3% |
| Immigrants | Panama | 41.8 /100 | #183 | Average 2.4% |
| Sri Lankans | 41.8 /100 | #184 | Average 2.4% |
| Nigerians | 41.0 /100 | #185 | Average 2.4% |
| Immigrants | Bosnia and Herzegovina | 40.4 /100 | #186 | Average 2.4% |
| Immigrants | Colombia | 34.0 /100 | #187 | Fair 2.4% |
| Hmong | 33.0 /100 | #188 | Fair 2.4% |
| U.S. Virgin Islanders | 31.8 /100 | #189 | Fair 2.4% |
| French | 31.7 /100 | #190 | Fair 2.4% |
| Immigrants | Africa | 30.0 /100 | #191 | Fair 2.4% |
| Immigrants | Sudan | 29.8 /100 | #192 | Fair 2.4% |
| Uruguayans | 29.7 /100 | #193 | Fair 2.4% |
| Panamanians | 29.6 /100 | #194 | Fair 2.4% |
| Immigrants | Philippines | 28.7 /100 | #195 | Fair 2.4% |
| Kenyans | 28.0 /100 | #196 | Fair 2.4% |