Russian vs Albanian Currently Married
COMPARE
Russian
Albanian
Currently Married
Currently Married Comparison
Russians
Albanians
48.6%
CURRENTLY MARRIED
98.9/ 100
METRIC RATING
52nd/ 347
METRIC RANK
47.0%
CURRENTLY MARRIED
68.6/ 100
METRIC RATING
154th/ 347
METRIC RANK
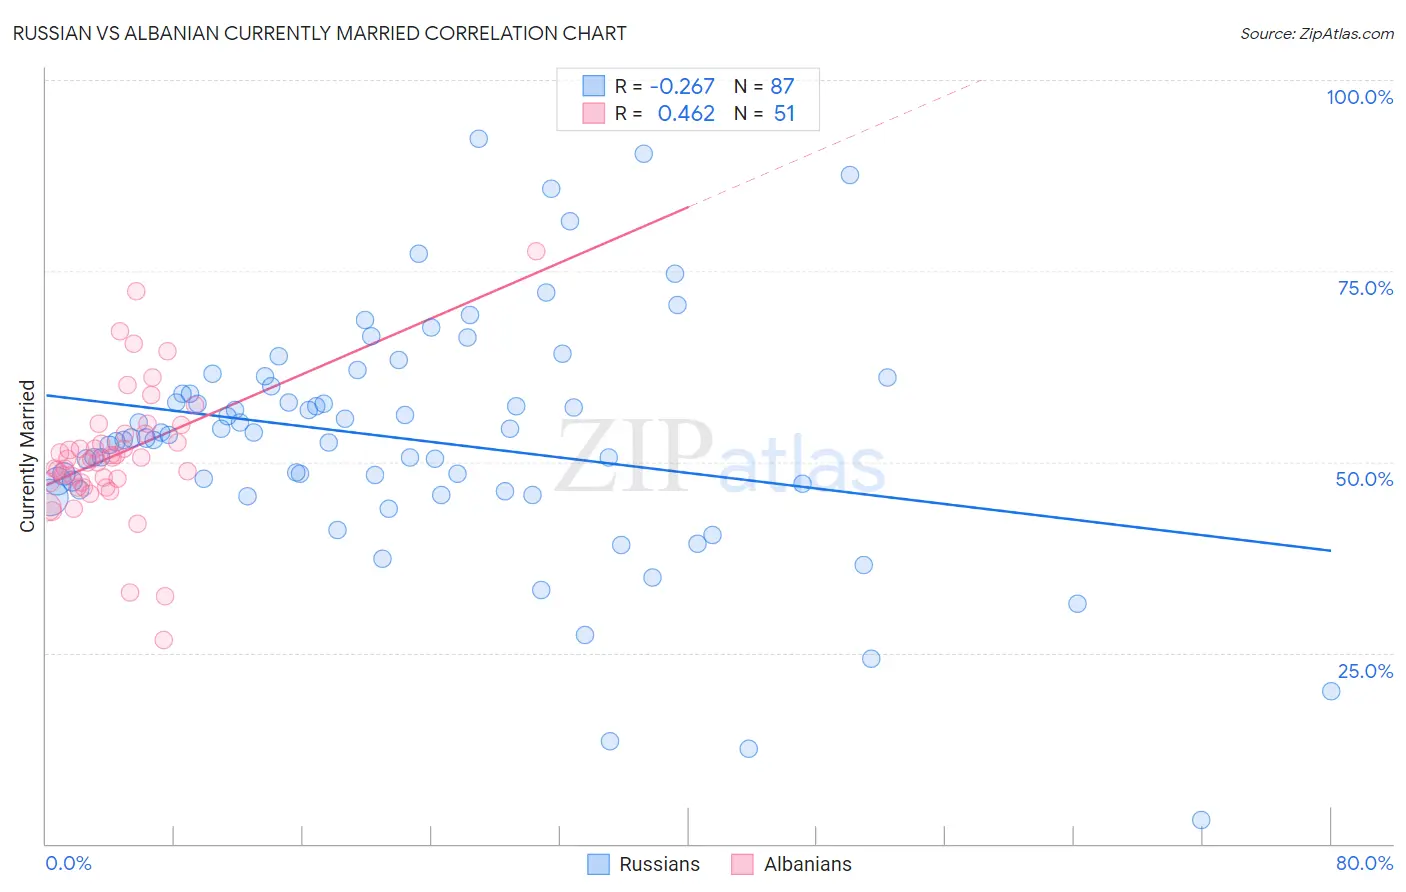
Russian vs Albanian Currently Married Correlation Chart
The statistical analysis conducted on geographies consisting of 512,168,988 people shows a weak negative correlation between the proportion of Russians and percentage of population currently married in the United States with a correlation coefficient (R) of -0.267 and weighted average of 48.6%. Similarly, the statistical analysis conducted on geographies consisting of 193,235,745 people shows a moderate positive correlation between the proportion of Albanians and percentage of population currently married in the United States with a correlation coefficient (R) of 0.462 and weighted average of 47.0%, a difference of 3.4%.
Currently Married Correlation Summary
| Measurement | Russian | Albanian |
| Minimum | 3.1% | 26.7% |
| Maximum | 92.3% | 77.6% |
| Range | 89.2% | 50.9% |
| Mean | 52.9% | 51.0% |
| Median | 53.1% | 50.5% |
| Interquartile 25% (IQ1) | 46.3% | 47.2% |
| Interquartile 75% (IQ3) | 59.8% | 53.7% |
| Interquartile Range (IQR) | 13.5% | 6.5% |
| Standard Deviation (Sample) | 15.7% | 8.8% |
| Standard Deviation (Population) | 15.6% | 8.7% |
Similar Demographics by Currently Married
Demographics Similar to Russians by Currently Married
In terms of currently married, the demographic groups most similar to Russians are Iranian (48.6%, a difference of 0.090%), White/Caucasian (48.6%, a difference of 0.090%), Immigrants from Austria (48.5%, a difference of 0.12%), Bhutanese (48.6%, a difference of 0.16%), and Immigrants from Moldova (48.5%, a difference of 0.18%).
| Demographics | Rating | Rank | Currently Married |
| Belgians | 99.3 /100 | #45 | Exceptional 48.7% |
| Immigrants | Iran | 99.2 /100 | #46 | Exceptional 48.7% |
| Northern Europeans | 99.2 /100 | #47 | Exceptional 48.7% |
| Austrians | 99.2 /100 | #48 | Exceptional 48.7% |
| Bhutanese | 99.1 /100 | #49 | Exceptional 48.6% |
| Iranians | 99.0 /100 | #50 | Exceptional 48.6% |
| Whites/Caucasians | 99.0 /100 | #51 | Exceptional 48.6% |
| Russians | 98.9 /100 | #52 | Exceptional 48.6% |
| Immigrants | Austria | 98.8 /100 | #53 | Exceptional 48.5% |
| Immigrants | Moldova | 98.7 /100 | #54 | Exceptional 48.5% |
| Immigrants | North Macedonia | 98.7 /100 | #55 | Exceptional 48.5% |
| Latvians | 98.7 /100 | #56 | Exceptional 48.5% |
| Immigrants | Netherlands | 98.6 /100 | #57 | Exceptional 48.5% |
| French | 98.6 /100 | #58 | Exceptional 48.4% |
| Immigrants | Ireland | 98.5 /100 | #59 | Exceptional 48.4% |
Demographics Similar to Albanians by Currently Married
In terms of currently married, the demographic groups most similar to Albanians are Immigrants from Venezuela (47.0%, a difference of 0.0%), Arab (47.0%, a difference of 0.0%), Immigrants from Serbia (47.0%, a difference of 0.010%), Spanish (47.0%, a difference of 0.020%), and Immigrants from Switzerland (46.9%, a difference of 0.030%).
| Demographics | Rating | Rank | Currently Married |
| Immigrants | Argentina | 72.0 /100 | #147 | Good 47.0% |
| Cambodians | 70.4 /100 | #148 | Good 47.0% |
| Zimbabweans | 70.1 /100 | #149 | Good 47.0% |
| Immigrants | Turkey | 70.0 /100 | #150 | Good 47.0% |
| Chileans | 69.8 /100 | #151 | Good 47.0% |
| Immigrants | Serbia | 68.8 /100 | #152 | Good 47.0% |
| Immigrants | Venezuela | 68.6 /100 | #153 | Good 47.0% |
| Albanians | 68.6 /100 | #154 | Good 47.0% |
| Arabs | 68.6 /100 | #155 | Good 47.0% |
| Spanish | 68.1 /100 | #156 | Good 47.0% |
| Immigrants | Switzerland | 67.8 /100 | #157 | Good 46.9% |
| Cherokee | 66.8 /100 | #158 | Good 46.9% |
| Iraqis | 66.4 /100 | #159 | Good 46.9% |
| Immigrants | Uzbekistan | 66.0 /100 | #160 | Good 46.9% |
| Immigrants | Southern Europe | 65.9 /100 | #161 | Good 46.9% |