Russian vs Immigrants from Kuwait High School Diploma
COMPARE
Russian
Immigrants from Kuwait
High School Diploma
High School Diploma Comparison
Russians
Immigrants from Kuwait
91.5%
HIGH SCHOOL DIPLOMA
99.9/ 100
METRIC RATING
26th/ 347
METRIC RANK
90.5%
HIGH SCHOOL DIPLOMA
98.3/ 100
METRIC RATING
97th/ 347
METRIC RANK
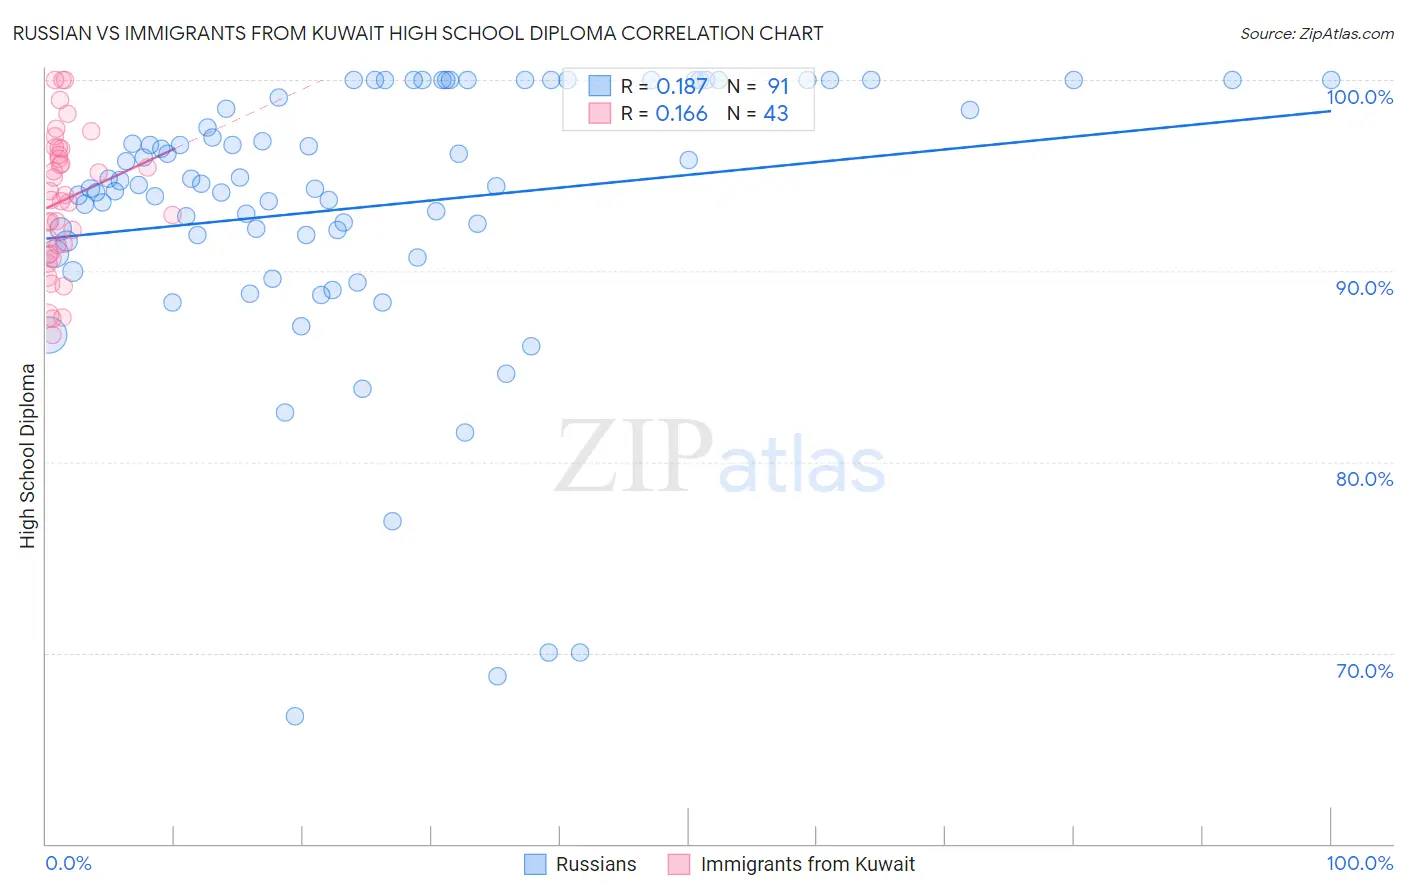
Russian vs Immigrants from Kuwait High School Diploma Correlation Chart
The statistical analysis conducted on geographies consisting of 512,259,122 people shows a poor positive correlation between the proportion of Russians and percentage of population with at least high school diploma education in the United States with a correlation coefficient (R) of 0.187 and weighted average of 91.5%. Similarly, the statistical analysis conducted on geographies consisting of 136,917,085 people shows a poor positive correlation between the proportion of Immigrants from Kuwait and percentage of population with at least high school diploma education in the United States with a correlation coefficient (R) of 0.166 and weighted average of 90.5%, a difference of 1.1%.
High School Diploma Correlation Summary
| Measurement | Russian | Immigrants from Kuwait |
| Minimum | 66.7% | 86.7% |
| Maximum | 100.0% | 100.0% |
| Range | 33.3% | 13.3% |
| Mean | 93.4% | 93.7% |
| Median | 94.5% | 93.7% |
| Interquartile 25% (IQ1) | 91.6% | 90.9% |
| Interquartile 75% (IQ3) | 100.0% | 96.4% |
| Interquartile Range (IQR) | 8.4% | 5.4% |
| Standard Deviation (Sample) | 7.2% | 3.6% |
| Standard Deviation (Population) | 7.2% | 3.5% |
Similar Demographics by High School Diploma
Demographics Similar to Russians by High School Diploma
In terms of high school diploma, the demographic groups most similar to Russians are Cypriot (91.5%, a difference of 0.010%), Italian (91.5%, a difference of 0.050%), Thai (91.5%, a difference of 0.050%), Tlingit-Haida (91.4%, a difference of 0.050%), and Scandinavian (91.5%, a difference of 0.060%).
| Demographics | Rating | Rank | High School Diploma |
| Maltese | 99.9 /100 | #19 | Exceptional 91.6% |
| Czechs | 99.9 /100 | #20 | Exceptional 91.6% |
| Filipinos | 99.9 /100 | #21 | Exceptional 91.6% |
| Estonians | 99.9 /100 | #22 | Exceptional 91.6% |
| Scandinavians | 99.9 /100 | #23 | Exceptional 91.5% |
| Italians | 99.9 /100 | #24 | Exceptional 91.5% |
| Thais | 99.9 /100 | #25 | Exceptional 91.5% |
| Russians | 99.9 /100 | #26 | Exceptional 91.5% |
| Cypriots | 99.9 /100 | #27 | Exceptional 91.5% |
| Tlingit-Haida | 99.9 /100 | #28 | Exceptional 91.4% |
| Europeans | 99.9 /100 | #29 | Exceptional 91.4% |
| Iranians | 99.9 /100 | #30 | Exceptional 91.4% |
| Immigrants | Northern Europe | 99.9 /100 | #31 | Exceptional 91.4% |
| English | 99.9 /100 | #32 | Exceptional 91.4% |
| Okinawans | 99.9 /100 | #33 | Exceptional 91.4% |
Demographics Similar to Immigrants from Kuwait by High School Diploma
In terms of high school diploma, the demographic groups most similar to Immigrants from Kuwait are Immigrants from Korea (90.5%, a difference of 0.0%), Immigrants from Europe (90.5%, a difference of 0.020%), Immigrants from Serbia (90.5%, a difference of 0.030%), Immigrants from North Macedonia (90.5%, a difference of 0.030%), and Immigrants from Israel (90.5%, a difference of 0.040%).
| Demographics | Rating | Rank | High School Diploma |
| Celtics | 98.7 /100 | #90 | Exceptional 90.6% |
| South Africans | 98.6 /100 | #91 | Exceptional 90.6% |
| Swiss | 98.6 /100 | #92 | Exceptional 90.6% |
| Immigrants | Western Europe | 98.6 /100 | #93 | Exceptional 90.6% |
| Immigrants | Israel | 98.5 /100 | #94 | Exceptional 90.5% |
| Icelanders | 98.5 /100 | #95 | Exceptional 90.5% |
| Immigrants | Serbia | 98.4 /100 | #96 | Exceptional 90.5% |
| Immigrants | Kuwait | 98.3 /100 | #97 | Exceptional 90.5% |
| Immigrants | Korea | 98.3 /100 | #98 | Exceptional 90.5% |
| Immigrants | Europe | 98.2 /100 | #99 | Exceptional 90.5% |
| Immigrants | North Macedonia | 98.1 /100 | #100 | Exceptional 90.5% |
| Immigrants | Norway | 98.0 /100 | #101 | Exceptional 90.5% |
| Aleuts | 98.0 /100 | #102 | Exceptional 90.4% |
| Immigrants | Romania | 97.8 /100 | #103 | Exceptional 90.4% |
| Immigrants | Croatia | 97.8 /100 | #104 | Exceptional 90.4% |