Russian vs Immigrants from Cuba Median Family Income
COMPARE
Russian
Immigrants from Cuba
Median Family Income
Median Family Income Comparison
Russians
Immigrants from Cuba
$120,487
MEDIAN FAMILY INCOME
100.0/ 100
METRIC RATING
27th/ 347
METRIC RANK
$78,249
MEDIAN FAMILY INCOME
0.0/ 100
METRIC RATING
336th/ 347
METRIC RANK
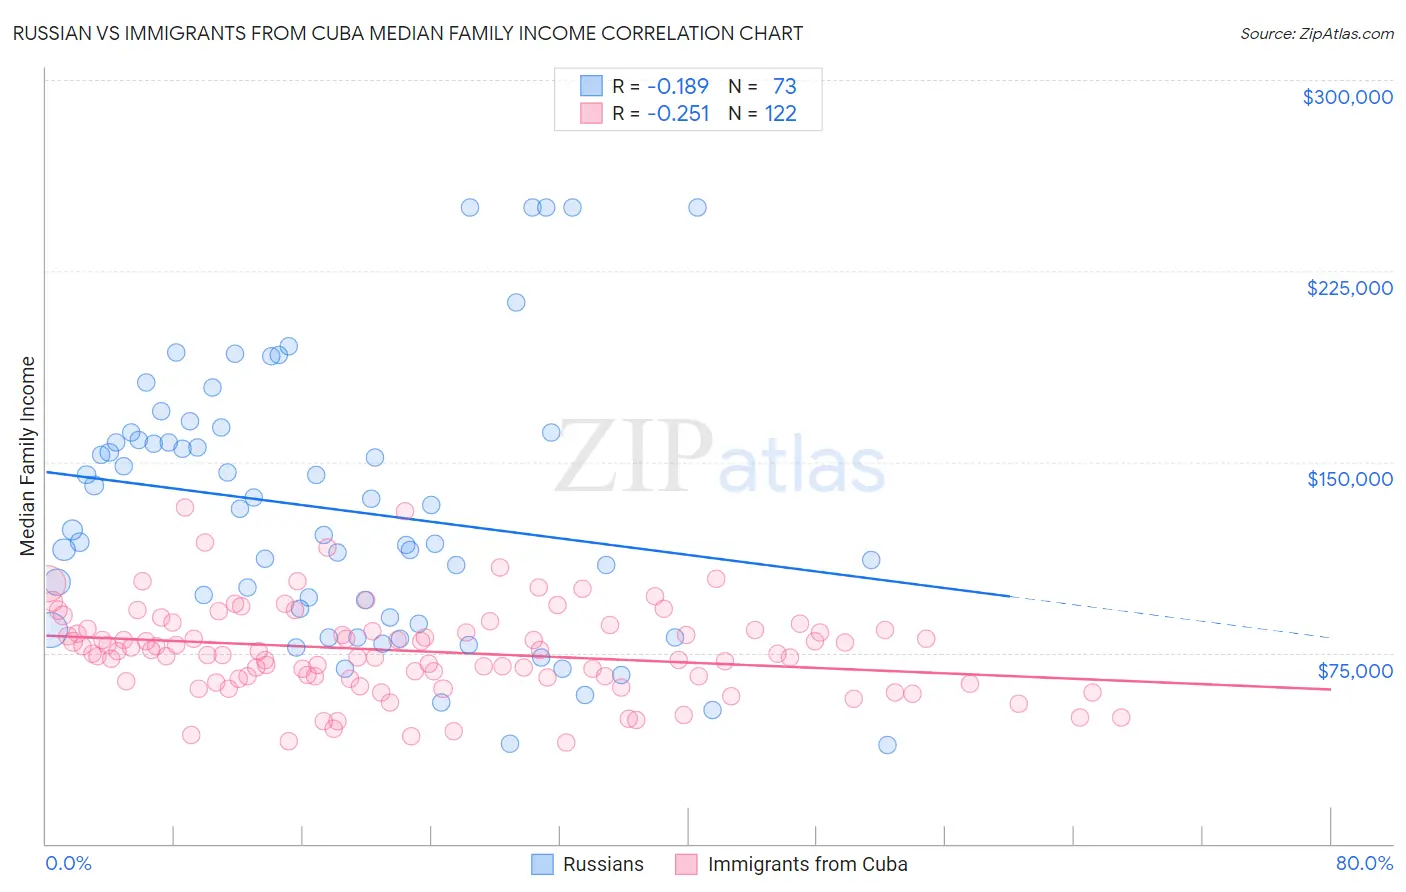
Russian vs Immigrants from Cuba Median Family Income Correlation Chart
The statistical analysis conducted on geographies consisting of 511,404,289 people shows a poor negative correlation between the proportion of Russians and median family income in the United States with a correlation coefficient (R) of -0.189 and weighted average of $120,487. Similarly, the statistical analysis conducted on geographies consisting of 325,826,414 people shows a weak negative correlation between the proportion of Immigrants from Cuba and median family income in the United States with a correlation coefficient (R) of -0.251 and weighted average of $78,249, a difference of 54.0%.
Median Family Income Correlation Summary
| Measurement | Russian | Immigrants from Cuba |
| Minimum | $38,939 | $39,559 |
| Maximum | $250,001 | $131,935 |
| Range | $211,062 | $92,376 |
| Mean | $131,214 | $75,634 |
| Median | $123,457 | $75,235 |
| Interquartile 25% (IQ1) | $87,492 | $64,988 |
| Interquartile 75% (IQ3) | $160,004 | $83,903 |
| Interquartile Range (IQR) | $72,512 | $18,915 |
| Standard Deviation (Sample) | $52,364 | $17,632 |
| Standard Deviation (Population) | $52,005 | $17,559 |
Similar Demographics by Median Family Income
Demographics Similar to Russians by Median Family Income
In terms of median family income, the demographic groups most similar to Russians are Immigrants from Denmark ($120,445, a difference of 0.040%), Latvian ($120,301, a difference of 0.15%), Immigrants from Sri Lanka ($120,263, a difference of 0.19%), Immigrants from Switzerland ($120,726, a difference of 0.20%), and Immigrants from France ($120,076, a difference of 0.34%).
| Demographics | Rating | Rank | Median Family Income |
| Burmese | 100.0 /100 | #20 | Exceptional $123,369 |
| Immigrants | Korea | 100.0 /100 | #21 | Exceptional $122,800 |
| Immigrants | Sweden | 100.0 /100 | #22 | Exceptional $122,765 |
| Immigrants | Japan | 100.0 /100 | #23 | Exceptional $122,764 |
| Immigrants | Northern Europe | 100.0 /100 | #24 | Exceptional $121,840 |
| Turks | 100.0 /100 | #25 | Exceptional $121,202 |
| Immigrants | Switzerland | 100.0 /100 | #26 | Exceptional $120,726 |
| Russians | 100.0 /100 | #27 | Exceptional $120,487 |
| Immigrants | Denmark | 100.0 /100 | #28 | Exceptional $120,445 |
| Latvians | 100.0 /100 | #29 | Exceptional $120,301 |
| Immigrants | Sri Lanka | 100.0 /100 | #30 | Exceptional $120,263 |
| Immigrants | France | 100.0 /100 | #31 | Exceptional $120,076 |
| Asians | 100.0 /100 | #32 | Exceptional $119,955 |
| Bhutanese | 100.0 /100 | #33 | Exceptional $119,800 |
| Bolivians | 100.0 /100 | #34 | Exceptional $119,479 |
Demographics Similar to Immigrants from Cuba by Median Family Income
In terms of median family income, the demographic groups most similar to Immigrants from Cuba are Yuman ($78,055, a difference of 0.25%), Immigrants from Yemen ($77,457, a difference of 1.0%), Pima ($77,431, a difference of 1.1%), Yup'ik ($79,290, a difference of 1.3%), and Hopi ($77,188, a difference of 1.4%).
| Demographics | Rating | Rank | Median Family Income |
| Dutch West Indians | 0.0 /100 | #329 | Tragic $81,852 |
| Cheyenne | 0.0 /100 | #330 | Tragic $81,385 |
| Immigrants | Dominican Republic | 0.0 /100 | #331 | Tragic $81,233 |
| Natives/Alaskans | 0.0 /100 | #332 | Tragic $80,908 |
| Kiowa | 0.0 /100 | #333 | Tragic $80,885 |
| Menominee | 0.0 /100 | #334 | Tragic $79,563 |
| Yup'ik | 0.0 /100 | #335 | Tragic $79,290 |
| Immigrants | Cuba | 0.0 /100 | #336 | Tragic $78,249 |
| Yuman | 0.0 /100 | #337 | Tragic $78,055 |
| Immigrants | Yemen | 0.0 /100 | #338 | Tragic $77,457 |
| Pima | 0.0 /100 | #339 | Tragic $77,431 |
| Hopi | 0.0 /100 | #340 | Tragic $77,188 |
| Pueblo | 0.0 /100 | #341 | Tragic $76,880 |
| Crow | 0.0 /100 | #342 | Tragic $76,605 |
| Houma | 0.0 /100 | #343 | Tragic $76,188 |