Immigrants from Pakistan vs Houma Single Father Households
COMPARE
Immigrants from Pakistan
Houma
Single Father Households
Single Father Households Comparison
Immigrants from Pakistan
Houma
2.1%
SINGLE FATHER HOUSEHOLDS
99.5/ 100
METRIC RATING
90th/ 347
METRIC RANK
2.9%
SINGLE FATHER HOUSEHOLDS
0.0/ 100
METRIC RATING
316th/ 347
METRIC RANK
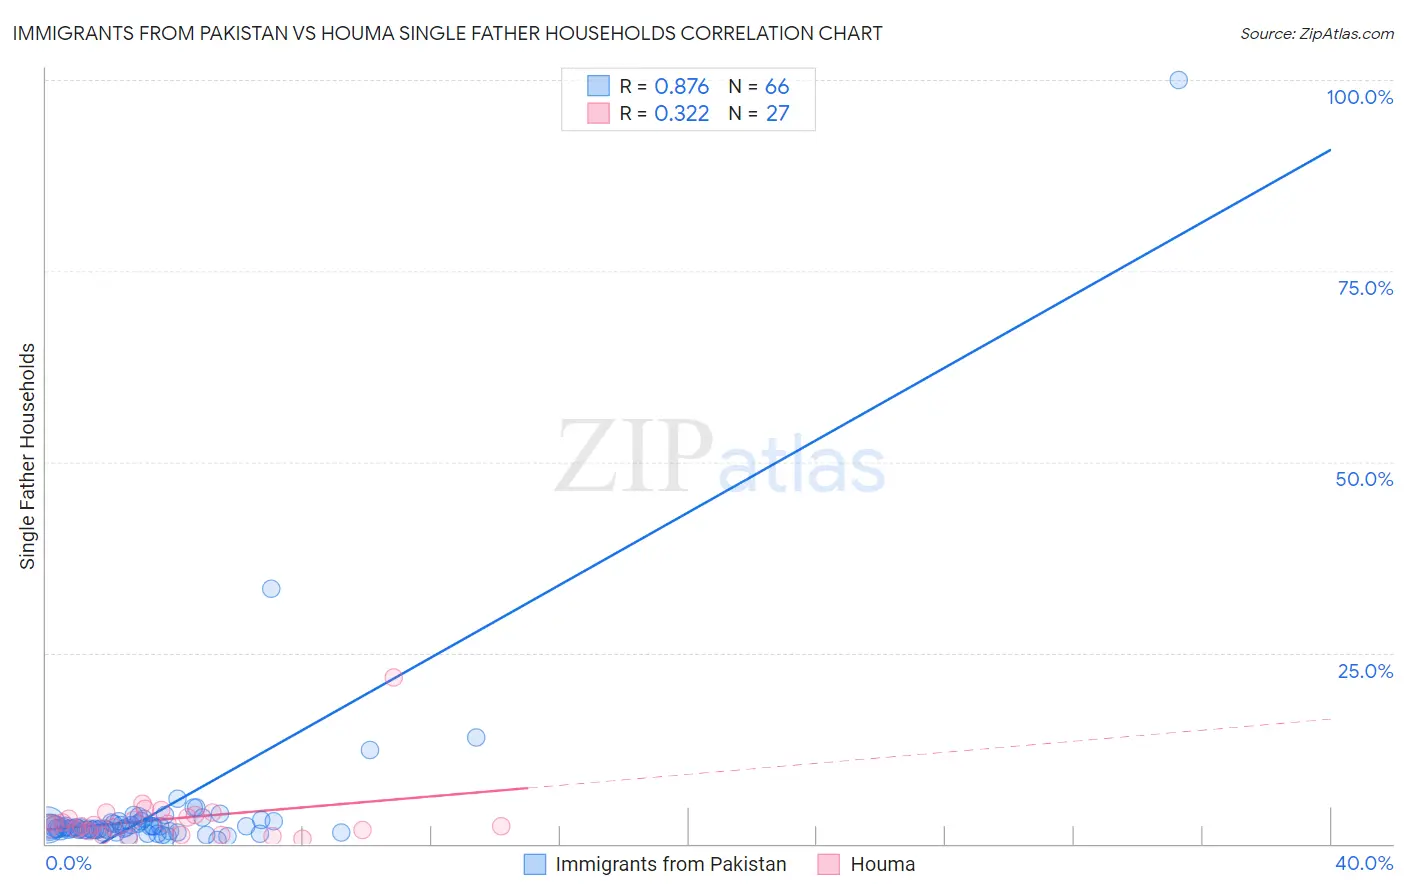
Immigrants from Pakistan vs Houma Single Father Households Correlation Chart
The statistical analysis conducted on geographies consisting of 282,609,848 people shows a very strong positive correlation between the proportion of Immigrants from Pakistan and percentage of single father households in the United States with a correlation coefficient (R) of 0.876 and weighted average of 2.1%. Similarly, the statistical analysis conducted on geographies consisting of 36,727,905 people shows a mild positive correlation between the proportion of Houma and percentage of single father households in the United States with a correlation coefficient (R) of 0.322 and weighted average of 2.9%, a difference of 38.1%.
Single Father Households Correlation Summary
| Measurement | Immigrants from Pakistan | Houma |
| Minimum | 0.53% | 0.65% |
| Maximum | 100.0% | 21.8% |
| Range | 99.5% | 21.2% |
| Mean | 4.6% | 3.3% |
| Median | 2.2% | 2.5% |
| Interquartile 25% (IQ1) | 1.8% | 1.7% |
| Interquartile 75% (IQ3) | 2.9% | 3.8% |
| Interquartile Range (IQR) | 1.1% | 2.1% |
| Standard Deviation (Sample) | 12.7% | 3.9% |
| Standard Deviation (Population) | 12.6% | 3.8% |
Similar Demographics by Single Father Households
Demographics Similar to Immigrants from Pakistan by Single Father Households
In terms of single father households, the demographic groups most similar to Immigrants from Pakistan are Immigrants from Armenia (2.1%, a difference of 0.010%), Bhutanese (2.1%, a difference of 0.060%), Lithuanian (2.1%, a difference of 0.19%), Immigrants from Guyana (2.1%, a difference of 0.24%), and Romanian (2.1%, a difference of 0.33%).
| Demographics | Rating | Rank | Single Father Households |
| Greeks | 99.7 /100 | #83 | Exceptional 2.1% |
| Carpatho Rusyns | 99.6 /100 | #84 | Exceptional 2.1% |
| Immigrants | Hungary | 99.6 /100 | #85 | Exceptional 2.1% |
| Asians | 99.6 /100 | #86 | Exceptional 2.1% |
| Lithuanians | 99.5 /100 | #87 | Exceptional 2.1% |
| Bhutanese | 99.5 /100 | #88 | Exceptional 2.1% |
| Immigrants | Armenia | 99.5 /100 | #89 | Exceptional 2.1% |
| Immigrants | Pakistan | 99.5 /100 | #90 | Exceptional 2.1% |
| Immigrants | Guyana | 99.4 /100 | #91 | Exceptional 2.1% |
| Romanians | 99.4 /100 | #92 | Exceptional 2.1% |
| Croatians | 99.3 /100 | #93 | Exceptional 2.1% |
| Ukrainians | 99.3 /100 | #94 | Exceptional 2.1% |
| Bermudans | 99.2 /100 | #95 | Exceptional 2.1% |
| Arabs | 99.2 /100 | #96 | Exceptional 2.1% |
| Immigrants | Moldova | 99.1 /100 | #97 | Exceptional 2.1% |
Demographics Similar to Houma by Single Father Households
In terms of single father households, the demographic groups most similar to Houma are Cheyenne (2.9%, a difference of 0.0%), Salvadoran (2.9%, a difference of 0.39%), Arapaho (2.9%, a difference of 0.64%), Immigrants from El Salvador (2.9%, a difference of 0.86%), and Cape Verdean (2.9%, a difference of 0.87%).
| Demographics | Rating | Rank | Single Father Households |
| Central Americans | 0.0 /100 | #309 | Tragic 2.9% |
| Immigrants | Laos | 0.0 /100 | #310 | Tragic 2.9% |
| Spanish American Indians | 0.0 /100 | #311 | Tragic 2.9% |
| Tsimshian | 0.0 /100 | #312 | Tragic 2.9% |
| Arapaho | 0.0 /100 | #313 | Tragic 2.9% |
| Salvadorans | 0.0 /100 | #314 | Tragic 2.9% |
| Cheyenne | 0.0 /100 | #315 | Tragic 2.9% |
| Houma | 0.0 /100 | #316 | Tragic 2.9% |
| Immigrants | El Salvador | 0.0 /100 | #317 | Tragic 2.9% |
| Cape Verdeans | 0.0 /100 | #318 | Tragic 2.9% |
| Ute | 0.0 /100 | #319 | Tragic 3.0% |
| Guatemalans | 0.0 /100 | #320 | Tragic 3.0% |
| Mexicans | 0.0 /100 | #321 | Tragic 3.0% |
| Immigrants | Guatemala | 0.0 /100 | #322 | Tragic 3.0% |
| Immigrants | Central America | 0.0 /100 | #323 | Tragic 3.0% |