Sioux vs Houma Single Father Households
COMPARE
Sioux
Houma
Single Father Households
Single Father Households Comparison
Sioux
Houma
3.3%
SINGLE FATHER HOUSEHOLDS
0.0/ 100
METRIC RATING
338th/ 347
METRIC RANK
2.9%
SINGLE FATHER HOUSEHOLDS
0.0/ 100
METRIC RATING
316th/ 347
METRIC RANK
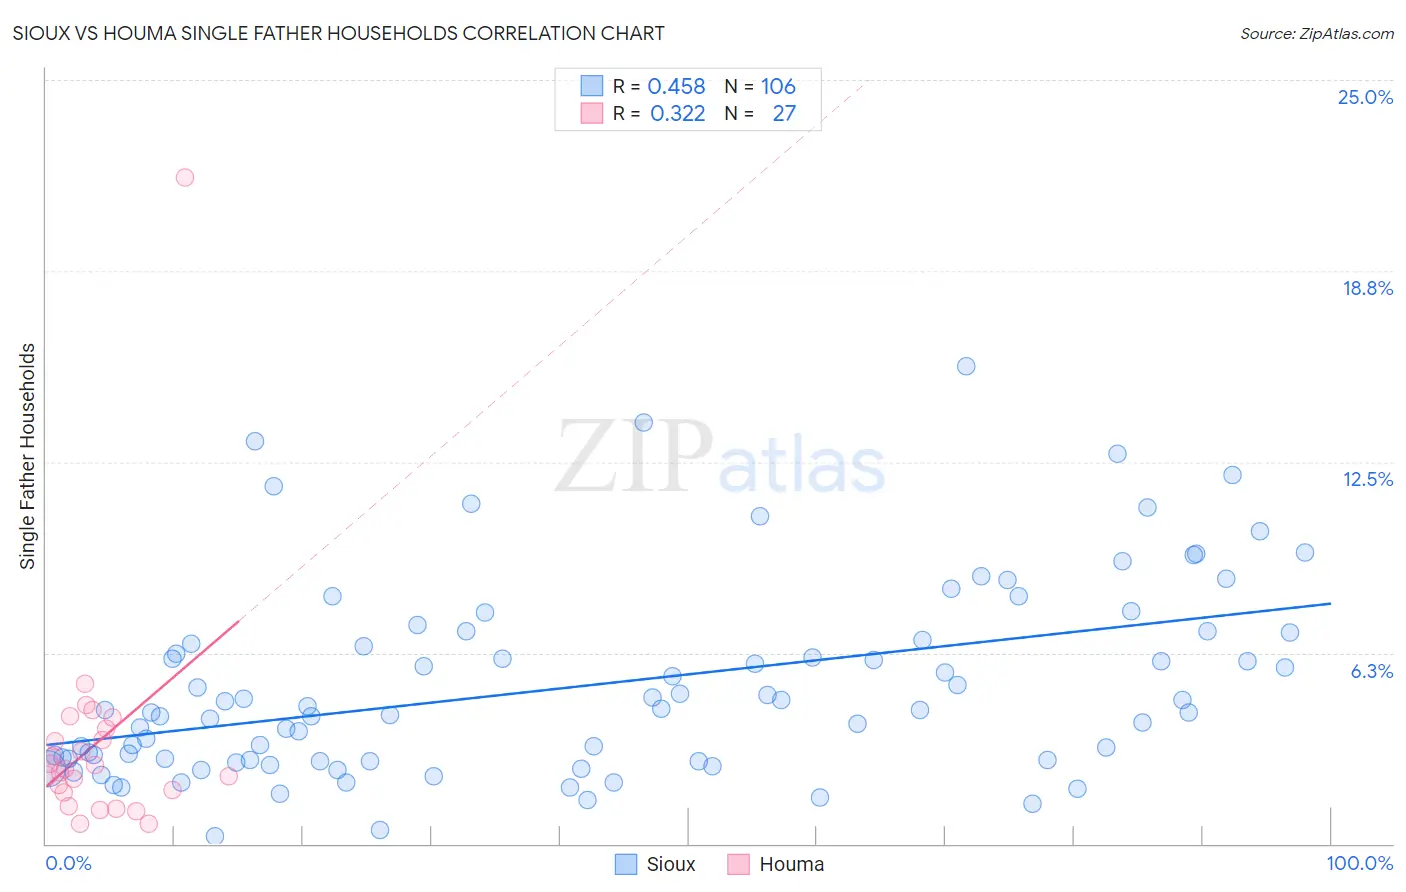
Sioux vs Houma Single Father Households Correlation Chart
The statistical analysis conducted on geographies consisting of 233,030,014 people shows a moderate positive correlation between the proportion of Sioux and percentage of single father households in the United States with a correlation coefficient (R) of 0.458 and weighted average of 3.3%. Similarly, the statistical analysis conducted on geographies consisting of 36,727,905 people shows a mild positive correlation between the proportion of Houma and percentage of single father households in the United States with a correlation coefficient (R) of 0.322 and weighted average of 2.9%, a difference of 13.9%.
Single Father Households Correlation Summary
| Measurement | Sioux | Houma |
| Minimum | 0.25% | 0.65% |
| Maximum | 15.6% | 21.8% |
| Range | 15.4% | 21.2% |
| Mean | 5.2% | 3.3% |
| Median | 4.4% | 2.5% |
| Interquartile 25% (IQ1) | 2.7% | 1.7% |
| Interquartile 75% (IQ3) | 6.7% | 3.8% |
| Interquartile Range (IQR) | 3.9% | 2.1% |
| Standard Deviation (Sample) | 3.2% | 3.9% |
| Standard Deviation (Population) | 3.2% | 3.8% |
Similar Demographics by Single Father Households
Demographics Similar to Sioux by Single Father Households
In terms of single father households, the demographic groups most similar to Sioux are Pueblo (3.3%, a difference of 0.68%), Paiute (3.3%, a difference of 0.94%), Colville (3.3%, a difference of 0.96%), Yuman (3.3%, a difference of 0.98%), and Alaskan Athabascan (3.4%, a difference of 1.5%).
| Demographics | Rating | Rank | Single Father Households |
| Navajo | 0.0 /100 | #331 | Tragic 3.2% |
| Yaqui | 0.0 /100 | #332 | Tragic 3.2% |
| Natives/Alaskans | 0.0 /100 | #333 | Tragic 3.2% |
| Yuman | 0.0 /100 | #334 | Tragic 3.3% |
| Colville | 0.0 /100 | #335 | Tragic 3.3% |
| Paiute | 0.0 /100 | #336 | Tragic 3.3% |
| Pueblo | 0.0 /100 | #337 | Tragic 3.3% |
| Sioux | 0.0 /100 | #338 | Tragic 3.3% |
| Alaskan Athabascans | 0.0 /100 | #339 | Tragic 3.4% |
| Alaska Natives | 0.0 /100 | #340 | Tragic 3.5% |
| Crow | 0.0 /100 | #341 | Tragic 3.5% |
| Tohono O'odham | 0.0 /100 | #342 | Tragic 3.8% |
| Pima | 0.0 /100 | #343 | Tragic 4.2% |
| Yakama | 0.0 /100 | #344 | Tragic 4.2% |
| Menominee | 0.0 /100 | #345 | Tragic 4.2% |
Demographics Similar to Houma by Single Father Households
In terms of single father households, the demographic groups most similar to Houma are Cheyenne (2.9%, a difference of 0.0%), Salvadoran (2.9%, a difference of 0.39%), Arapaho (2.9%, a difference of 0.64%), Immigrants from El Salvador (2.9%, a difference of 0.86%), and Cape Verdean (2.9%, a difference of 0.87%).
| Demographics | Rating | Rank | Single Father Households |
| Central Americans | 0.0 /100 | #309 | Tragic 2.9% |
| Immigrants | Laos | 0.0 /100 | #310 | Tragic 2.9% |
| Spanish American Indians | 0.0 /100 | #311 | Tragic 2.9% |
| Tsimshian | 0.0 /100 | #312 | Tragic 2.9% |
| Arapaho | 0.0 /100 | #313 | Tragic 2.9% |
| Salvadorans | 0.0 /100 | #314 | Tragic 2.9% |
| Cheyenne | 0.0 /100 | #315 | Tragic 2.9% |
| Houma | 0.0 /100 | #316 | Tragic 2.9% |
| Immigrants | El Salvador | 0.0 /100 | #317 | Tragic 2.9% |
| Cape Verdeans | 0.0 /100 | #318 | Tragic 2.9% |
| Ute | 0.0 /100 | #319 | Tragic 3.0% |
| Guatemalans | 0.0 /100 | #320 | Tragic 3.0% |
| Mexicans | 0.0 /100 | #321 | Tragic 3.0% |
| Immigrants | Guatemala | 0.0 /100 | #322 | Tragic 3.0% |
| Immigrants | Central America | 0.0 /100 | #323 | Tragic 3.0% |