Puerto Rican vs Immigrants from India Single Father Households
COMPARE
Puerto Rican
Immigrants from India
Single Father Households
Single Father Households Comparison
Puerto Ricans
Immigrants from India
2.6%
SINGLE FATHER HOUSEHOLDS
0.2/ 100
METRIC RATING
274th/ 347
METRIC RANK
1.9%
SINGLE FATHER HOUSEHOLDS
100.0/ 100
METRIC RATING
17th/ 347
METRIC RANK
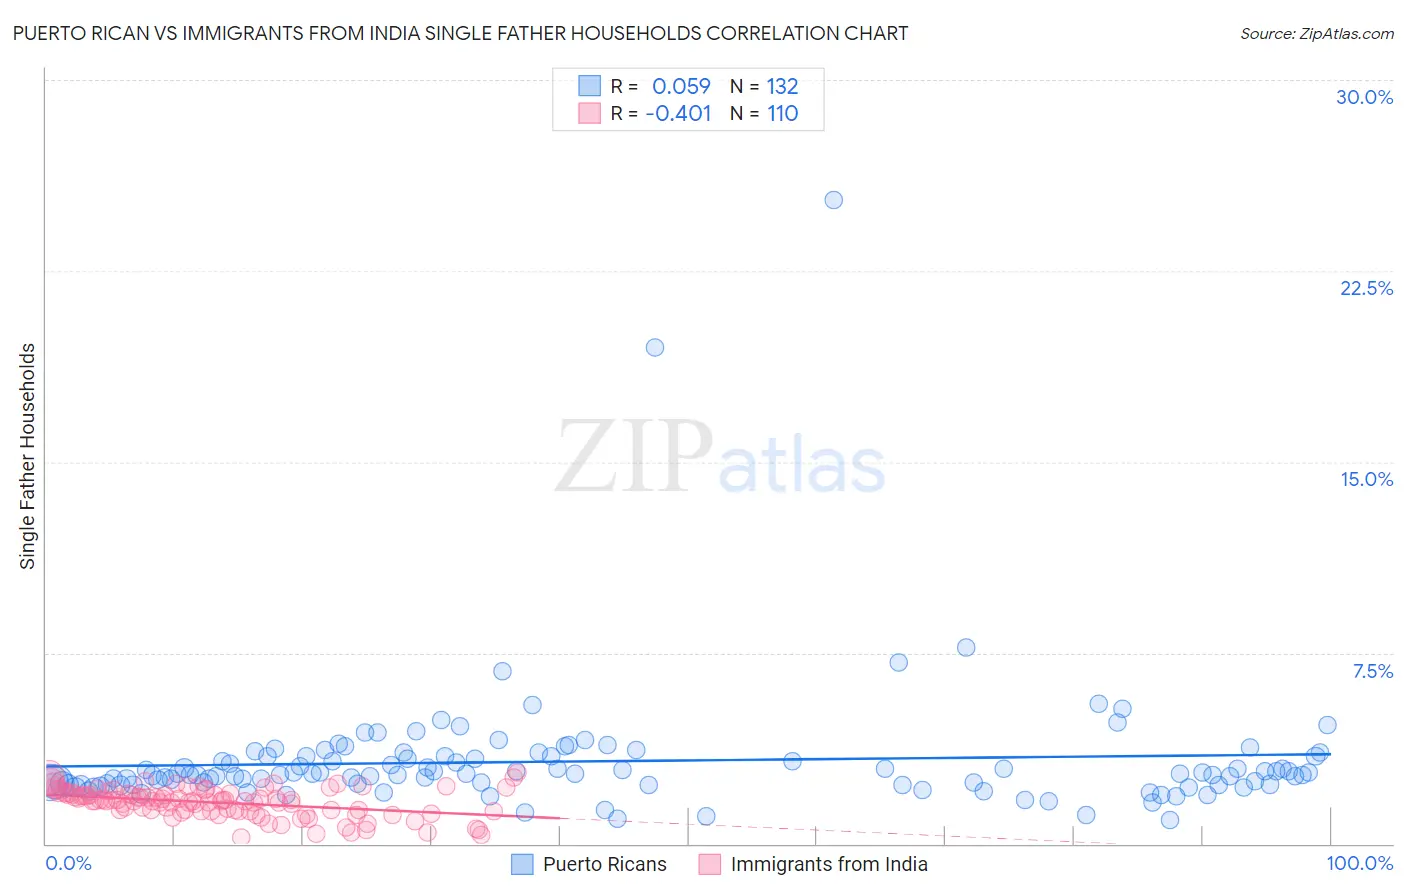
Puerto Rican vs Immigrants from India Single Father Households Correlation Chart
The statistical analysis conducted on geographies consisting of 519,503,962 people shows a slight positive correlation between the proportion of Puerto Ricans and percentage of single father households in the United States with a correlation coefficient (R) of 0.059 and weighted average of 2.6%. Similarly, the statistical analysis conducted on geographies consisting of 429,563,662 people shows a moderate negative correlation between the proportion of Immigrants from India and percentage of single father households in the United States with a correlation coefficient (R) of -0.401 and weighted average of 1.9%, a difference of 37.3%.
Single Father Households Correlation Summary
| Measurement | Puerto Rican | Immigrants from India |
| Minimum | 0.92% | 0.27% |
| Maximum | 25.3% | 2.8% |
| Range | 24.4% | 2.5% |
| Mean | 3.2% | 1.6% |
| Median | 2.7% | 1.7% |
| Interquartile 25% (IQ1) | 2.3% | 1.3% |
| Interquartile 75% (IQ3) | 3.5% | 2.0% |
| Interquartile Range (IQR) | 1.1% | 0.67% |
| Standard Deviation (Sample) | 2.6% | 0.55% |
| Standard Deviation (Population) | 2.6% | 0.54% |
Similar Demographics by Single Father Households
Demographics Similar to Puerto Ricans by Single Father Households
In terms of single father households, the demographic groups most similar to Puerto Ricans are Iroquois (2.6%, a difference of 0.030%), Creek (2.6%, a difference of 0.070%), Belizean (2.6%, a difference of 0.070%), Immigrants from Dominican Republic (2.6%, a difference of 0.42%), and Seminole (2.6%, a difference of 0.44%).
| Demographics | Rating | Rank | Single Father Households |
| Guamanians/Chamorros | 0.4 /100 | #267 | Tragic 2.6% |
| Haitians | 0.4 /100 | #268 | Tragic 2.6% |
| Cubans | 0.3 /100 | #269 | Tragic 2.6% |
| Seminole | 0.3 /100 | #270 | Tragic 2.6% |
| Creek | 0.2 /100 | #271 | Tragic 2.6% |
| Belizeans | 0.2 /100 | #272 | Tragic 2.6% |
| Iroquois | 0.2 /100 | #273 | Tragic 2.6% |
| Puerto Ricans | 0.2 /100 | #274 | Tragic 2.6% |
| Immigrants | Dominican Republic | 0.2 /100 | #275 | Tragic 2.6% |
| Immigrants | Haiti | 0.1 /100 | #276 | Tragic 2.6% |
| Shoshone | 0.1 /100 | #277 | Tragic 2.6% |
| Cherokee | 0.1 /100 | #278 | Tragic 2.6% |
| Samoans | 0.1 /100 | #279 | Tragic 2.6% |
| Immigrants | Portugal | 0.1 /100 | #280 | Tragic 2.6% |
| Nicaraguans | 0.1 /100 | #281 | Tragic 2.6% |
Demographics Similar to Immigrants from India by Single Father Households
In terms of single father households, the demographic groups most similar to Immigrants from India are Immigrants from Iran (1.9%, a difference of 0.23%), Immigrants from Eastern Asia (1.9%, a difference of 0.43%), Indian (Asian) (1.9%, a difference of 0.50%), Immigrants from Lithuania (1.9%, a difference of 0.58%), and Iranian (1.9%, a difference of 1.3%).
| Demographics | Rating | Rank | Single Father Households |
| Okinawans | 100.0 /100 | #10 | Exceptional 1.9% |
| Immigrants | Belarus | 100.0 /100 | #11 | Exceptional 1.9% |
| Immigrants | Greece | 100.0 /100 | #12 | Exceptional 1.9% |
| Immigrants | Singapore | 100.0 /100 | #13 | Exceptional 1.9% |
| Immigrants | Lithuania | 100.0 /100 | #14 | Exceptional 1.9% |
| Immigrants | Eastern Asia | 100.0 /100 | #15 | Exceptional 1.9% |
| Immigrants | Iran | 100.0 /100 | #16 | Exceptional 1.9% |
| Immigrants | India | 100.0 /100 | #17 | Exceptional 1.9% |
| Indians (Asian) | 100.0 /100 | #18 | Exceptional 1.9% |
| Iranians | 100.0 /100 | #19 | Exceptional 1.9% |
| Thais | 100.0 /100 | #20 | Exceptional 1.9% |
| Immigrants | Albania | 100.0 /100 | #21 | Exceptional 1.9% |
| Immigrants | Latvia | 100.0 /100 | #22 | Exceptional 1.9% |
| Immigrants | Croatia | 100.0 /100 | #23 | Exceptional 2.0% |
| Immigrants | Russia | 100.0 /100 | #24 | Exceptional 2.0% |