Pueblo vs Subsaharan African Unemployment

COMPARE

Pueblo
Race
Ancestry
AfghanAfricanAlaska NativeAlaskan AthabascanAlbanianAleutAlsatianAmericanApacheArabArapahoArgentineanArmenianAssyrian/Chaldean/SyriacAustralianAustrianBahamianBangladeshiBarbadianBasqueBelgianBelizeanBermudanBhutaneseBlackfeetBolivianBrazilianBritishBritish West IndianBulgarianBurmeseCajunCambodianCanadianCape VerdeanCarpatho RusynCelticCentral AmericanCentral American IndianCherokeeCheyenneChickasawChileanChineseChippewaChoctawColombianColvilleComancheCosta RicanCreeCreekCroatianCrowCubanCypriotCzechCzechoslovakianDanishDelawareDominicanDutchDutch West IndianEastern EuropeanEcuadorianEgyptianEnglishEstonianEthiopianEuropeanFijianFilipinoFinnishFrenchFrench American IndianFrench CanadianGermanGerman RussianGhanaianGreekGuamanian/ChamorroGuatemalanGuyaneseHaitianHmongHonduranHopiHoumaHungarianIcelanderIndian (Asian)IndonesianInupiatIranianIraqiIrishIroquoisIsraeliItalianJamaicanJapaneseJordanianKenyanKiowaKoreanLaotianLatvianLebaneseLiberianLithuanianLumbeeLuxembourgerMacedonianMalaysianMalteseMarshalleseMenomineeMexicanMexican American IndianMongolianMoroccanNative HawaiianNavajoNepaleseNew ZealanderNicaraguanNigerianNorthern EuropeanNorwegianOkinawanOsageOttawaPaiutePakistaniPalestinianPanamanianParaguayanPennsylvania GermanPeruvianPimaPolishPortuguesePotawatomiPuebloPuerto RicanPuget Sound SalishRomanianRussianSalvadoranSamoanScandinavianScotch-IrishScottishSeminoleSenegaleseSerbianShoshoneSierra LeoneanSiouxSlavicSlovakSloveneSomaliSouth AfricanSouth AmericanSouth American IndianSoviet UnionSpaniardSpanishSpanish AmericanSpanish American IndianSri LankanSudaneseSwedishSwissSyrianTaiwaneseThaiTlingit-HaidaTohono O'OdhamTonganTrinidadian and TobagonianTsimshianTurkishU.S. Virgin IslanderUgandanUkrainianUruguayanUteVenezuelanVietnameseWelshWest IndianYakamaYaquiYugoslavianYumanYup'ikZimbabwean
Immigration
NonimmigrantsImmigrantsAfghanistanAfricaAlbaniaArgentinaArmeniaAsiaAustraliaAustriaBahamasBangladeshBarbadosBelarusBelgiumBelizeBoliviaBosnia and HerzegovinaBrazilBulgariaBurma/MyanmarCabo VerdeCambodiaCameroonCanadaCaribbeanCentral AmericaChileChinaColombiaCongoCosta RicaCroatiaCubaCzechoslovakiaDenmarkDominicaDominican RepublicEastern AfricaEastern AsiaEastern EuropeEcuadorEgyptEl SalvadorEnglandEritreaEthiopiaEuropeFijiFranceGermanyGhanaGreeceGrenadaGuatemalaGuyanaHaitiHondurasHong KongHungaryIndiaIndonesiaIranIraqIrelandIsraelItalyJamaicaJapanJordanKazakhstanKenyaKoreaKuwaitLaosLatin AmericaLatviaLebanonLiberiaLithuaniaMalaysiaMexicoMicronesiaMiddle AfricaMoldovaMoroccoNepalNetherlandsNicaraguaNigeriaNorth AmericaNorth MacedoniaNorthern AfricaNorthern EuropeNorwayOceaniaPakistanPanamaPeruPhilippinesPolandPortugalRomaniaRussiaSaudi ArabiaScotlandSenegalSerbiaSierra LeoneSingaporeSomaliaSouth AfricaSouth AmericaSouth Central AsiaSouth Eastern AsiaSouthern EuropeSpainSri LankaSt. Vincent and the GrenadinesSudanSwedenSwitzerlandSyriaTaiwanThailandTrinidad and TobagoTurkeyUgandaUkraineUruguayUzbekistanVenezuelaVietnamWest IndiesWestern AfricaWestern AsiaWestern EuropeYemenZaireZimbabweAzores
Subsaharan African
Race
Ancestry
AfghanAfricanAlaska NativeAlaskan AthabascanAlbanianAleutAlsatianAmericanApacheArabArapahoArgentineanArmenianAssyrian/Chaldean/SyriacAustralianAustrianBahamianBangladeshiBarbadianBasqueBelgianBelizeanBermudanBhutaneseBlackfeetBolivianBrazilianBritishBritish West IndianBulgarianBurmeseCajunCambodianCanadianCape VerdeanCarpatho RusynCelticCentral AmericanCentral American IndianCherokeeCheyenneChickasawChileanChineseChippewaChoctawColombianColvilleComancheCosta RicanCreeCreekCroatianCrowCubanCypriotCzechCzechoslovakianDanishDelawareDominicanDutchDutch West IndianEastern EuropeanEcuadorianEgyptianEnglishEstonianEthiopianEuropeanFijianFilipinoFinnishFrenchFrench American IndianFrench CanadianGermanGerman RussianGhanaianGreekGuamanian/ChamorroGuatemalanGuyaneseHaitianHmongHonduranHopiHoumaHungarianIcelanderIndian (Asian)IndonesianInupiatIranianIraqiIrishIroquoisIsraeliItalianJamaicanJapaneseJordanianKenyanKiowaKoreanLaotianLatvianLebaneseLiberianLithuanianLumbeeLuxembourgerMacedonianMalaysianMalteseMarshalleseMenomineeMexicanMexican American IndianMongolianMoroccanNative HawaiianNavajoNepaleseNew ZealanderNicaraguanNigerianNorthern EuropeanNorwegianOkinawanOsageOttawaPaiutePakistaniPalestinianPanamanianParaguayanPennsylvania GermanPeruvianPimaPolishPortuguesePotawatomiPuerto RicanPuget Sound SalishRomanianRussianSalvadoranSamoanScandinavianScotch-IrishScottishSeminoleSenegaleseSerbianShoshoneSierra LeoneanSiouxSlavicSlovakSloveneSomaliSouth AfricanSouth AmericanSouth American IndianSoviet UnionSpaniardSpanishSpanish AmericanSpanish American IndianSri LankanSubsaharan AfricanSudaneseSwedishSwissSyrianTaiwaneseThaiTlingit-HaidaTohono O'OdhamTonganTrinidadian and TobagonianTsimshianTurkishU.S. Virgin IslanderUgandanUkrainianUruguayanUteVenezuelanVietnameseWelshWest IndianYakamaYaquiYugoslavianYumanYup'ikZimbabwean
Immigration
NonimmigrantsImmigrantsAfghanistanAfricaAlbaniaArgentinaArmeniaAsiaAustraliaAustriaBahamasBangladeshBarbadosBelarusBelgiumBelizeBoliviaBosnia and HerzegovinaBrazilBulgariaBurma/MyanmarCabo VerdeCambodiaCameroonCanadaCaribbeanCentral AmericaChileChinaColombiaCongoCosta RicaCroatiaCubaCzechoslovakiaDenmarkDominicaDominican RepublicEastern AfricaEastern AsiaEastern EuropeEcuadorEgyptEl SalvadorEnglandEritreaEthiopiaEuropeFijiFranceGermanyGhanaGreeceGrenadaGuatemalaGuyanaHaitiHondurasHong KongHungaryIndiaIndonesiaIranIraqIrelandIsraelItalyJamaicaJapanJordanKazakhstanKenyaKoreaKuwaitLaosLatin AmericaLatviaLebanonLiberiaLithuaniaMalaysiaMexicoMicronesiaMiddle AfricaMoldovaMoroccoNepalNetherlandsNicaraguaNigeriaNorth AmericaNorth MacedoniaNorthern AfricaNorthern EuropeNorwayOceaniaPakistanPanamaPeruPhilippinesPolandPortugalRomaniaRussiaSaudi ArabiaScotlandSenegalSerbiaSierra LeoneSingaporeSomaliaSouth AfricaSouth AmericaSouth Central AsiaSouth Eastern AsiaSouthern EuropeSpainSri LankaSt. Vincent and the GrenadinesSudanSwedenSwitzerlandSyriaTaiwanThailandTrinidad and TobagoTurkeyUgandaUkraineUruguayUzbekistanVenezuelaVietnamWest IndiesWestern AfricaWestern AsiaWestern EuropeYemenZaireZimbabweAzores
Unemployment
Income
Poverty
Unemployment
Labor Participation
Family Structure
Vehicle Availability
Education Level
Disability

Unemployment Comparison

Pueblo

Sub-Saharan Africans

Tragic
Tragic
7.2%
UNEMPLOYMENT
0.0/ 100
METRIC RATING
327th/ 347
METRIC RANK
5.8%
UNEMPLOYMENT
0.1/ 100
METRIC RATING
259th/ 347
METRIC RANK

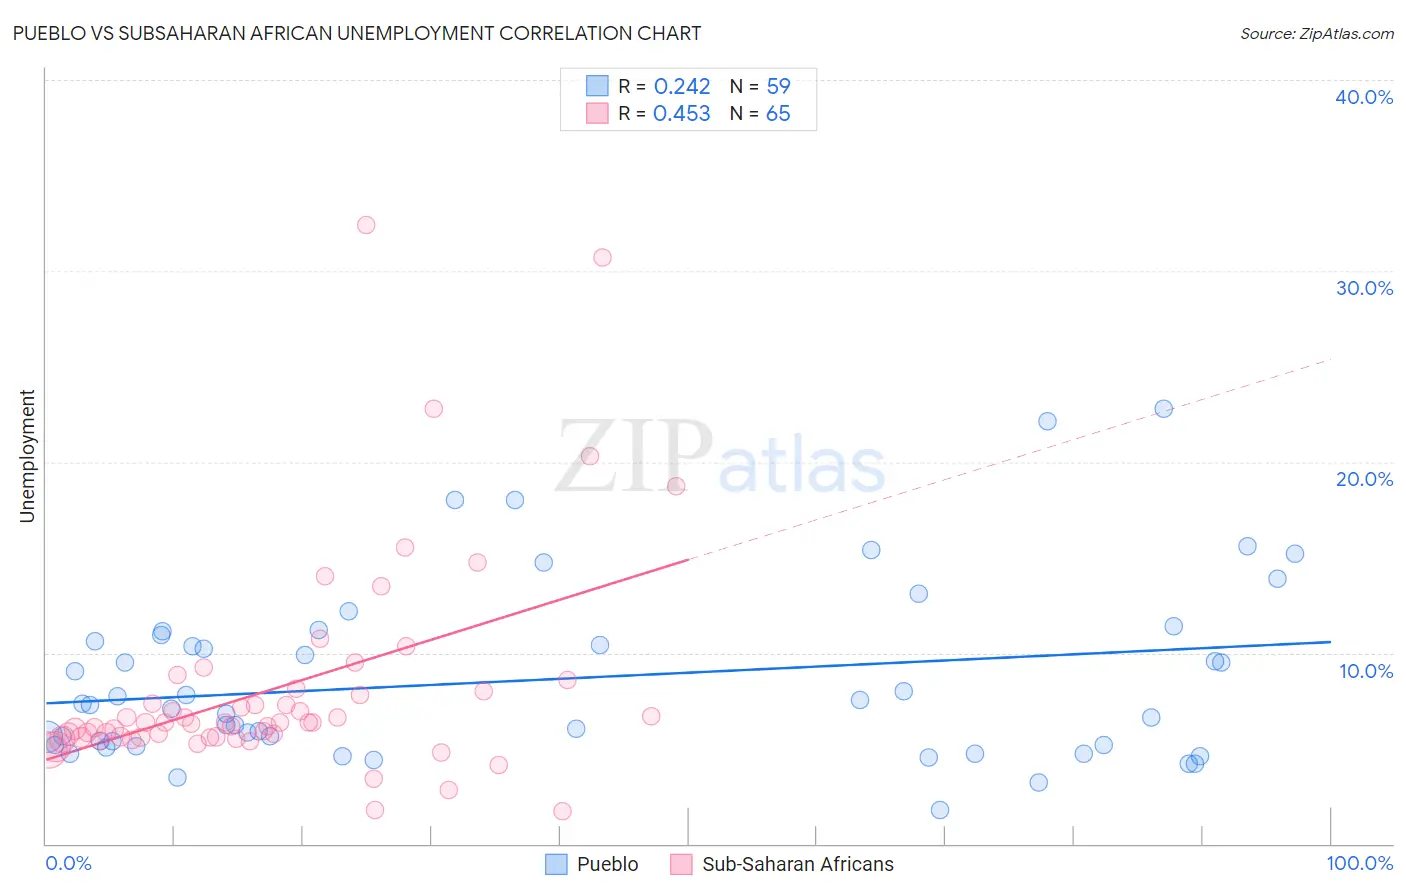
Pueblo vs Subsaharan African Unemployment Correlation Chart

The statistical analysis conducted on geographies consisting of 120,042,060 people shows a weak positive correlation between the proportion of Pueblo and unemployment in the United States with a correlation coefficient (R) of 0.242 and weighted average of 7.2%. Similarly, the statistical analysis conducted on geographies consisting of 507,124,054 people shows a moderate positive correlation between the proportion of Sub-Saharan Africans and unemployment in the United States with a correlation coefficient (R) of 0.453 and weighted average of 5.8%, a difference of 23.5%.
Pueblo vs Subsaharan African Unemployment

Unemployment Correlation Summary

MeasurementPuebloSubsaharan African
Minimum1.8%1.7%
Maximum22.8%32.4%
Range21.0%30.7%
Mean8.6%8.2%
Median7.3%6.3%
Interquartile 25% (IQ1)5.2%5.6%
Interquartile 75% (IQ3)10.9%8.0%
Interquartile Range (IQR)5.7%2.5%
Standard Deviation (Sample)4.6%5.7%
Standard Deviation (Population)4.6%5.7%

Similar Demographics by Unemployment

Demographics Similar to Pueblo by Unemployment

In terms of unemployment, the demographic groups most similar to Pueblo are Paiute (7.1%, a difference of 0.53%), Tsimshian (7.2%, a difference of 0.91%), Alaska Native (7.2%, a difference of 1.2%), Native/Alaskan (7.0%, a difference of 1.7%), and Immigrants from Armenia (7.0%, a difference of 2.3%).
DemographicsRating | RankUnemployment
Immigrants | St. Vincent and the Grenadines
0.0
/100
|
#320
Tragic
6.9%
Immigrants | Guyana
0.0
/100
|
#321
Tragic
6.9%
Guyanese
0.0
/100
|
#322
Tragic
6.9%
Immigrants | Grenada
0.0
/100
|
#323
Tragic
6.9%
Immigrants | Armenia
0.0
/100
|
#324
Tragic
7.0%
Natives/Alaskans
0.0
/100
|
#325
Tragic
7.0%
Paiute
0.0
/100
|
#326
Tragic
7.1%
Pueblo
0.0
/100
|
#327
Tragic
7.2%
Tsimshian
0.0
/100
|
#328
Tragic
7.2%
Alaska Natives
0.0
/100
|
#329
Tragic
7.2%
Yakama
0.0
/100
|
#330
Tragic
7.3%
Dominicans
0.0
/100
|
#331
Tragic
7.4%
Sioux
0.0
/100
|
#332
Tragic
7.4%
Immigrants | Dominican Republic
0.0
/100
|
#333
Tragic
7.4%
Apache
0.0
/100
|
#334
Tragic
7.4%

Demographics Similar to Sub-Saharan Africans by Unemployment

In terms of unemployment, the demographic groups most similar to Sub-Saharan Africans are Immigrants from Uzbekistan (5.8%, a difference of 0.020%), Immigrants from Guatemala (5.8%, a difference of 0.040%), Immigrants from Bahamas (5.8%, a difference of 0.12%), Sierra Leonean (5.8%, a difference of 0.14%), and Salvadoran (5.8%, a difference of 0.17%).
DemographicsRating | RankUnemployment
Hondurans
0.3
/100
|
#252
Tragic
5.7%
Central Americans
0.3
/100
|
#253
Tragic
5.7%
Immigrants | Honduras
0.3
/100
|
#254
Tragic
5.7%
Immigrants | Portugal
0.2
/100
|
#255
Tragic
5.7%
Guatemalans
0.2
/100
|
#256
Tragic
5.8%
Yaqui
0.2
/100
|
#257
Tragic
5.8%
Immigrants | Bahamas
0.1
/100
|
#258
Tragic
5.8%
Sub-Saharan Africans
0.1
/100
|
#259
Tragic
5.8%
Immigrants | Uzbekistan
0.1
/100
|
#260
Tragic
5.8%
Immigrants | Guatemala
0.1
/100
|
#261
Tragic
5.8%
Sierra Leoneans
0.1
/100
|
#262
Tragic
5.8%
Salvadorans
0.1
/100
|
#263
Tragic
5.8%
Immigrants | Liberia
0.1
/100
|
#264
Tragic
5.8%
Nigerians
0.1
/100
|
#265
Tragic
5.8%
Mexican American Indians
0.1
/100
|
#266
Tragic
5.8%