Pueblo vs Immigrants from Panama Average Family Size
COMPARE
Pueblo
Immigrants from Panama
Average Family Size
Average Family Size Comparison
Pueblo
Immigrants from Panama
3.79
AVERAGE FAMILY SIZE
100/ 100
METRIC RATING
3rd/ 347
METRIC RANK
3.27
AVERAGE FAMILY SIZE
95.6/ 100
METRIC RATING
113th/ 347
METRIC RANK
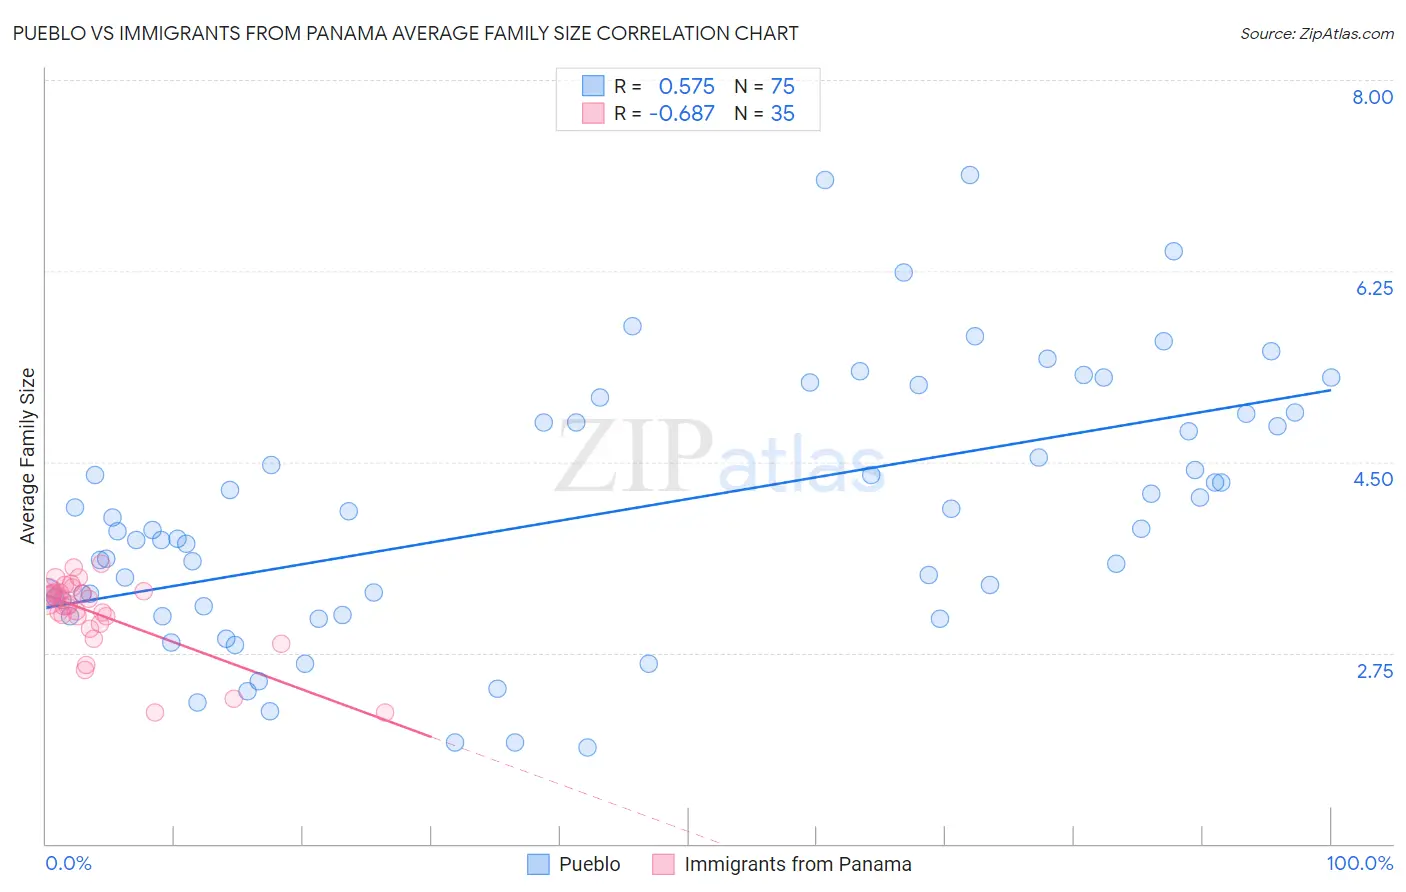
Pueblo vs Immigrants from Panama Average Family Size Correlation Chart
The statistical analysis conducted on geographies consisting of 120,067,636 people shows a substantial positive correlation between the proportion of Pueblo and average family size in the United States with a correlation coefficient (R) of 0.575 and weighted average of 3.79. Similarly, the statistical analysis conducted on geographies consisting of 221,156,465 people shows a significant negative correlation between the proportion of Immigrants from Panama and average family size in the United States with a correlation coefficient (R) of -0.687 and weighted average of 3.27, a difference of 15.9%.
Average Family Size Correlation Summary
| Measurement | Pueblo | Immigrants from Panama |
| Minimum | 1.88 | 2.20 |
| Maximum | 7.13 | 3.57 |
| Range | 5.25 | 1.37 |
| Mean | 4.02 | 3.11 |
| Median | 3.88 | 3.18 |
| Interquartile 25% (IQ1) | 3.17 | 3.02 |
| Interquartile 75% (IQ3) | 4.86 | 3.30 |
| Interquartile Range (IQR) | 1.69 | 0.28 |
| Standard Deviation (Sample) | 1.18 | 0.34 |
| Standard Deviation (Population) | 1.18 | 0.34 |
Similar Demographics by Average Family Size
Demographics Similar to Pueblo by Average Family Size
In terms of average family size, the demographic groups most similar to Pueblo are Crow (3.82, a difference of 0.81%), Pima (3.75, a difference of 1.3%), Navajo (3.65, a difference of 4.1%), Arapaho (3.64, a difference of 4.4%), and Inupiat (3.63, a difference of 4.6%).
| Demographics | Rating | Rank | Average Family Size |
| Yup'ik | 100 /100 | #1 | Exceptional 4.00 |
| Crow | 100 /100 | #2 | Exceptional 3.82 |
| Pueblo | 100 /100 | #3 | Exceptional 3.79 |
| Pima | 100 /100 | #4 | Exceptional 3.75 |
| Navajo | 100.0 /100 | #5 | Exceptional 3.65 |
| Arapaho | 100.0 /100 | #6 | Exceptional 3.64 |
| Inupiat | 100.0 /100 | #7 | Exceptional 3.63 |
| Immigrants | Yemen | 100.0 /100 | #8 | Exceptional 3.60 |
| Hopi | 100.0 /100 | #9 | Exceptional 3.60 |
| Spanish American Indians | 100.0 /100 | #10 | Exceptional 3.58 |
| Tohono O'odham | 100.0 /100 | #11 | Exceptional 3.53 |
| Immigrants | Mexico | 100.0 /100 | #12 | Exceptional 3.52 |
| Sioux | 100.0 /100 | #13 | Exceptional 3.52 |
| Immigrants | Central America | 100.0 /100 | #14 | Exceptional 3.49 |
| Tongans | 100.0 /100 | #15 | Exceptional 3.49 |
Demographics Similar to Immigrants from Panama by Average Family Size
In terms of average family size, the demographic groups most similar to Immigrants from Panama are Black/African American (3.27, a difference of 0.010%), South American (3.27, a difference of 0.050%), Immigrants from Liberia (3.27, a difference of 0.060%), Immigrants from South America (3.27, a difference of 0.060%), and Indonesian (3.28, a difference of 0.070%).
| Demographics | Rating | Rank | Average Family Size |
| Paiute | 98.0 /100 | #106 | Exceptional 3.29 |
| Ghanaians | 98.0 /100 | #107 | Exceptional 3.29 |
| Asians | 97.0 /100 | #108 | Exceptional 3.28 |
| Puerto Ricans | 96.7 /100 | #109 | Exceptional 3.28 |
| Bahamians | 96.6 /100 | #110 | Exceptional 3.28 |
| Indonesians | 96.2 /100 | #111 | Exceptional 3.28 |
| Blacks/African Americans | 95.7 /100 | #112 | Exceptional 3.27 |
| Immigrants | Panama | 95.6 /100 | #113 | Exceptional 3.27 |
| South Americans | 95.1 /100 | #114 | Exceptional 3.27 |
| Immigrants | Liberia | 95.0 /100 | #115 | Exceptional 3.27 |
| Immigrants | South America | 95.0 /100 | #116 | Exceptional 3.27 |
| Kiowa | 94.8 /100 | #117 | Exceptional 3.27 |
| Immigrants | Asia | 94.0 /100 | #118 | Exceptional 3.27 |
| Immigrants | Indonesia | 93.7 /100 | #119 | Exceptional 3.27 |
| Immigrants | Bahamas | 93.6 /100 | #120 | Exceptional 3.27 |