Pueblo vs Czech Average Family Size
COMPARE
Pueblo
Czech
Average Family Size
Average Family Size Comparison
Pueblo
Czechs
3.79
AVERAGE FAMILY SIZE
100/ 100
METRIC RATING
3rd/ 347
METRIC RANK
3.11
AVERAGE FAMILY SIZE
0.0/ 100
METRIC RATING
328th/ 347
METRIC RANK
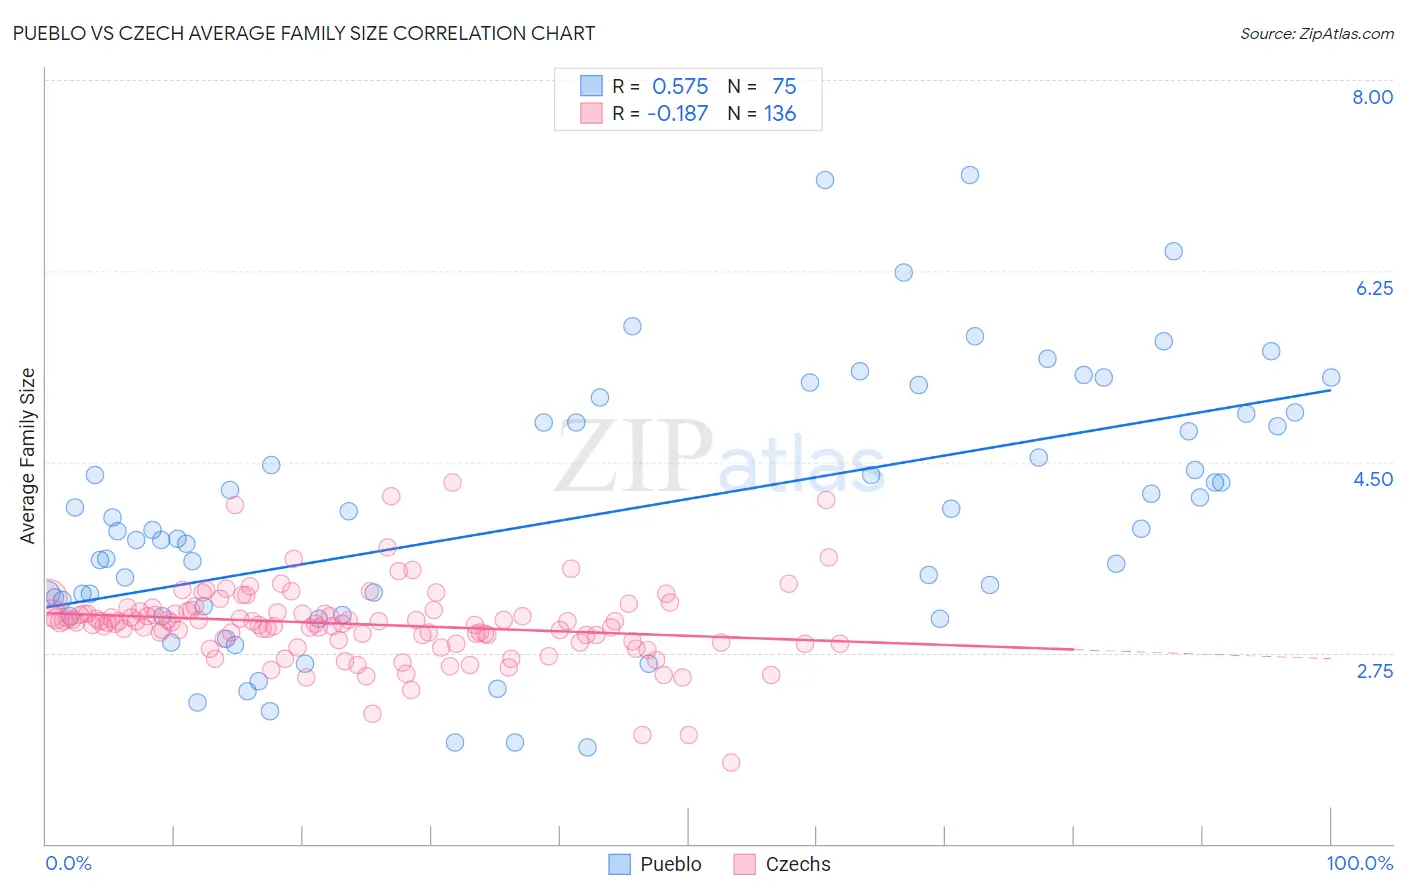
Pueblo vs Czech Average Family Size Correlation Chart
The statistical analysis conducted on geographies consisting of 120,067,636 people shows a substantial positive correlation between the proportion of Pueblo and average family size in the United States with a correlation coefficient (R) of 0.575 and weighted average of 3.79. Similarly, the statistical analysis conducted on geographies consisting of 484,474,906 people shows a poor negative correlation between the proportion of Czechs and average family size in the United States with a correlation coefficient (R) of -0.187 and weighted average of 3.11, a difference of 22.0%.
Average Family Size Correlation Summary
| Measurement | Pueblo | Czech |
| Minimum | 1.88 | 1.75 |
| Maximum | 7.13 | 4.31 |
| Range | 5.25 | 2.56 |
| Mean | 4.02 | 3.01 |
| Median | 3.88 | 3.03 |
| Interquartile 25% (IQ1) | 3.17 | 2.86 |
| Interquartile 75% (IQ3) | 4.86 | 3.12 |
| Interquartile Range (IQR) | 1.69 | 0.26 |
| Standard Deviation (Sample) | 1.18 | 0.36 |
| Standard Deviation (Population) | 1.18 | 0.36 |
Similar Demographics by Average Family Size
Demographics Similar to Pueblo by Average Family Size
In terms of average family size, the demographic groups most similar to Pueblo are Crow (3.82, a difference of 0.81%), Pima (3.75, a difference of 1.3%), Navajo (3.65, a difference of 4.1%), Arapaho (3.64, a difference of 4.4%), and Inupiat (3.63, a difference of 4.6%).
| Demographics | Rating | Rank | Average Family Size |
| Yup'ik | 100 /100 | #1 | Exceptional 4.00 |
| Crow | 100 /100 | #2 | Exceptional 3.82 |
| Pueblo | 100 /100 | #3 | Exceptional 3.79 |
| Pima | 100 /100 | #4 | Exceptional 3.75 |
| Navajo | 100.0 /100 | #5 | Exceptional 3.65 |
| Arapaho | 100.0 /100 | #6 | Exceptional 3.64 |
| Inupiat | 100.0 /100 | #7 | Exceptional 3.63 |
| Immigrants | Yemen | 100.0 /100 | #8 | Exceptional 3.60 |
| Hopi | 100.0 /100 | #9 | Exceptional 3.60 |
| Spanish American Indians | 100.0 /100 | #10 | Exceptional 3.58 |
| Tohono O'odham | 100.0 /100 | #11 | Exceptional 3.53 |
| Immigrants | Mexico | 100.0 /100 | #12 | Exceptional 3.52 |
| Sioux | 100.0 /100 | #13 | Exceptional 3.52 |
| Immigrants | Central America | 100.0 /100 | #14 | Exceptional 3.49 |
| Tongans | 100.0 /100 | #15 | Exceptional 3.49 |
Demographics Similar to Czechs by Average Family Size
In terms of average family size, the demographic groups most similar to Czechs are Dutch (3.11, a difference of 0.0%), Ottawa (3.11, a difference of 0.010%), English (3.11, a difference of 0.060%), Belgian (3.11, a difference of 0.060%), and Celtic (3.11, a difference of 0.10%).
| Demographics | Rating | Rank | Average Family Size |
| Immigrants | Austria | 0.0 /100 | #321 | Tragic 3.12 |
| Immigrants | Canada | 0.0 /100 | #322 | Tragic 3.12 |
| Soviet Union | 0.0 /100 | #323 | Tragic 3.11 |
| Celtics | 0.0 /100 | #324 | Tragic 3.11 |
| English | 0.0 /100 | #325 | Tragic 3.11 |
| Ottawa | 0.0 /100 | #326 | Tragic 3.11 |
| Dutch | 0.0 /100 | #327 | Tragic 3.11 |
| Czechs | 0.0 /100 | #328 | Tragic 3.11 |
| Belgians | 0.0 /100 | #329 | Tragic 3.11 |
| Latvians | 0.0 /100 | #330 | Tragic 3.11 |
| Scotch-Irish | 0.0 /100 | #331 | Tragic 3.11 |
| Scottish | 0.0 /100 | #332 | Tragic 3.11 |
| Estonians | 0.0 /100 | #333 | Tragic 3.10 |
| Lithuanians | 0.0 /100 | #334 | Tragic 3.10 |
| Luxembourgers | 0.0 /100 | #335 | Tragic 3.10 |