Aleut vs Russian Currently Married
COMPARE
Aleut
Russian
Currently Married
Currently Married Comparison
Aleuts
Russians
46.7%
CURRENTLY MARRIED
52.0/ 100
METRIC RATING
172nd/ 347
METRIC RANK
48.6%
CURRENTLY MARRIED
98.9/ 100
METRIC RATING
52nd/ 347
METRIC RANK
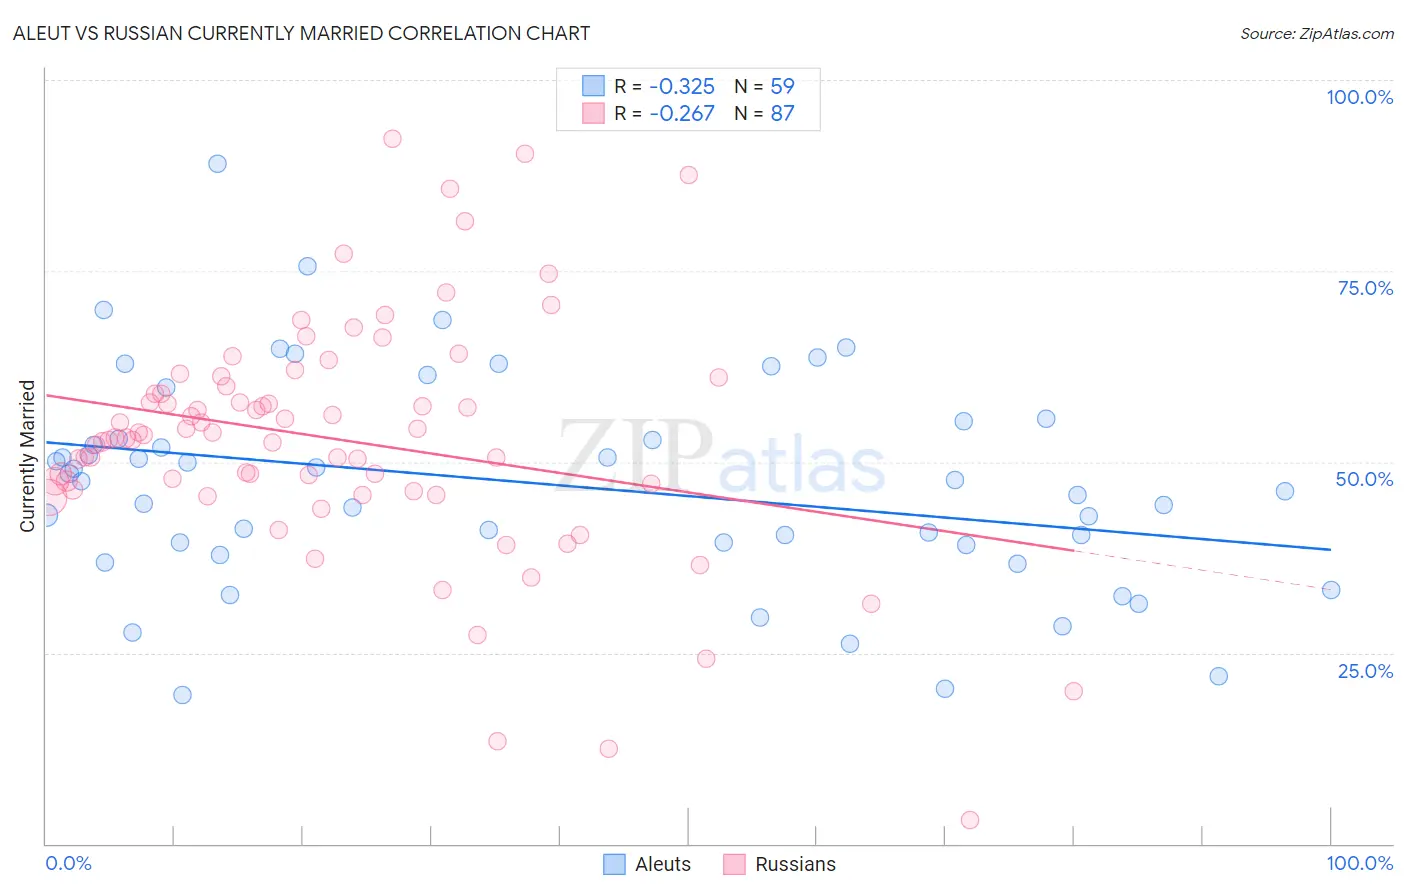
Aleut vs Russian Currently Married Correlation Chart
The statistical analysis conducted on geographies consisting of 61,778,471 people shows a mild negative correlation between the proportion of Aleuts and percentage of population currently married in the United States with a correlation coefficient (R) of -0.325 and weighted average of 46.7%. Similarly, the statistical analysis conducted on geographies consisting of 512,168,988 people shows a weak negative correlation between the proportion of Russians and percentage of population currently married in the United States with a correlation coefficient (R) of -0.267 and weighted average of 48.6%, a difference of 4.1%.
Currently Married Correlation Summary
| Measurement | Aleut | Russian |
| Minimum | 19.5% | 3.1% |
| Maximum | 89.1% | 92.3% |
| Range | 69.6% | 89.2% |
| Mean | 47.2% | 52.9% |
| Median | 47.4% | 53.1% |
| Interquartile 25% (IQ1) | 39.1% | 46.3% |
| Interquartile 75% (IQ3) | 55.3% | 59.8% |
| Interquartile Range (IQR) | 16.2% | 13.5% |
| Standard Deviation (Sample) | 14.0% | 15.7% |
| Standard Deviation (Population) | 13.9% | 15.6% |
Similar Demographics by Currently Married
Demographics Similar to Aleuts by Currently Married
In terms of currently married, the demographic groups most similar to Aleuts are Immigrants from Zimbabwe (46.7%, a difference of 0.010%), Tlingit-Haida (46.7%, a difference of 0.030%), Peruvian (46.6%, a difference of 0.070%), Immigrants from Brazil (46.6%, a difference of 0.080%), and Hawaiian (46.6%, a difference of 0.13%).
| Demographics | Rating | Rank | Currently Married |
| Samoans | 59.8 /100 | #165 | Average 46.8% |
| Immigrants | Syria | 59.3 /100 | #166 | Average 46.8% |
| Spaniards | 58.8 /100 | #167 | Average 46.8% |
| Immigrants | Afghanistan | 58.2 /100 | #168 | Average 46.8% |
| Armenians | 58.2 /100 | #169 | Average 46.8% |
| Immigrants | Latvia | 56.7 /100 | #170 | Average 46.7% |
| Immigrants | Zimbabwe | 52.4 /100 | #171 | Average 46.7% |
| Aleuts | 52.0 /100 | #172 | Average 46.7% |
| Tlingit-Haida | 51.2 /100 | #173 | Average 46.7% |
| Peruvians | 50.0 /100 | #174 | Average 46.6% |
| Immigrants | Brazil | 49.9 /100 | #175 | Average 46.6% |
| Hawaiians | 48.6 /100 | #176 | Average 46.6% |
| Israelis | 48.6 /100 | #177 | Average 46.6% |
| Chickasaw | 47.8 /100 | #178 | Average 46.6% |
| Immigrants | Oceania | 44.6 /100 | #179 | Average 46.5% |
Demographics Similar to Russians by Currently Married
In terms of currently married, the demographic groups most similar to Russians are Iranian (48.6%, a difference of 0.090%), White/Caucasian (48.6%, a difference of 0.090%), Immigrants from Austria (48.5%, a difference of 0.12%), Bhutanese (48.6%, a difference of 0.16%), and Immigrants from Moldova (48.5%, a difference of 0.18%).
| Demographics | Rating | Rank | Currently Married |
| Belgians | 99.3 /100 | #45 | Exceptional 48.7% |
| Immigrants | Iran | 99.2 /100 | #46 | Exceptional 48.7% |
| Northern Europeans | 99.2 /100 | #47 | Exceptional 48.7% |
| Austrians | 99.2 /100 | #48 | Exceptional 48.7% |
| Bhutanese | 99.1 /100 | #49 | Exceptional 48.6% |
| Iranians | 99.0 /100 | #50 | Exceptional 48.6% |
| Whites/Caucasians | 99.0 /100 | #51 | Exceptional 48.6% |
| Russians | 98.9 /100 | #52 | Exceptional 48.6% |
| Immigrants | Austria | 98.8 /100 | #53 | Exceptional 48.5% |
| Immigrants | Moldova | 98.7 /100 | #54 | Exceptional 48.5% |
| Immigrants | North Macedonia | 98.7 /100 | #55 | Exceptional 48.5% |
| Latvians | 98.7 /100 | #56 | Exceptional 48.5% |
| Immigrants | Netherlands | 98.6 /100 | #57 | Exceptional 48.5% |
| French | 98.6 /100 | #58 | Exceptional 48.4% |
| Immigrants | Ireland | 98.5 /100 | #59 | Exceptional 48.4% |