Immigrants from Ethiopia vs Inupiat Average Family Size
COMPARE
Immigrants from Ethiopia
Inupiat
Average Family Size
Average Family Size Comparison
Immigrants from Ethiopia
Inupiat
3.25
AVERAGE FAMILY SIZE
81.6/ 100
METRIC RATING
139th/ 347
METRIC RANK
3.63
AVERAGE FAMILY SIZE
100.0/ 100
METRIC RATING
7th/ 347
METRIC RANK
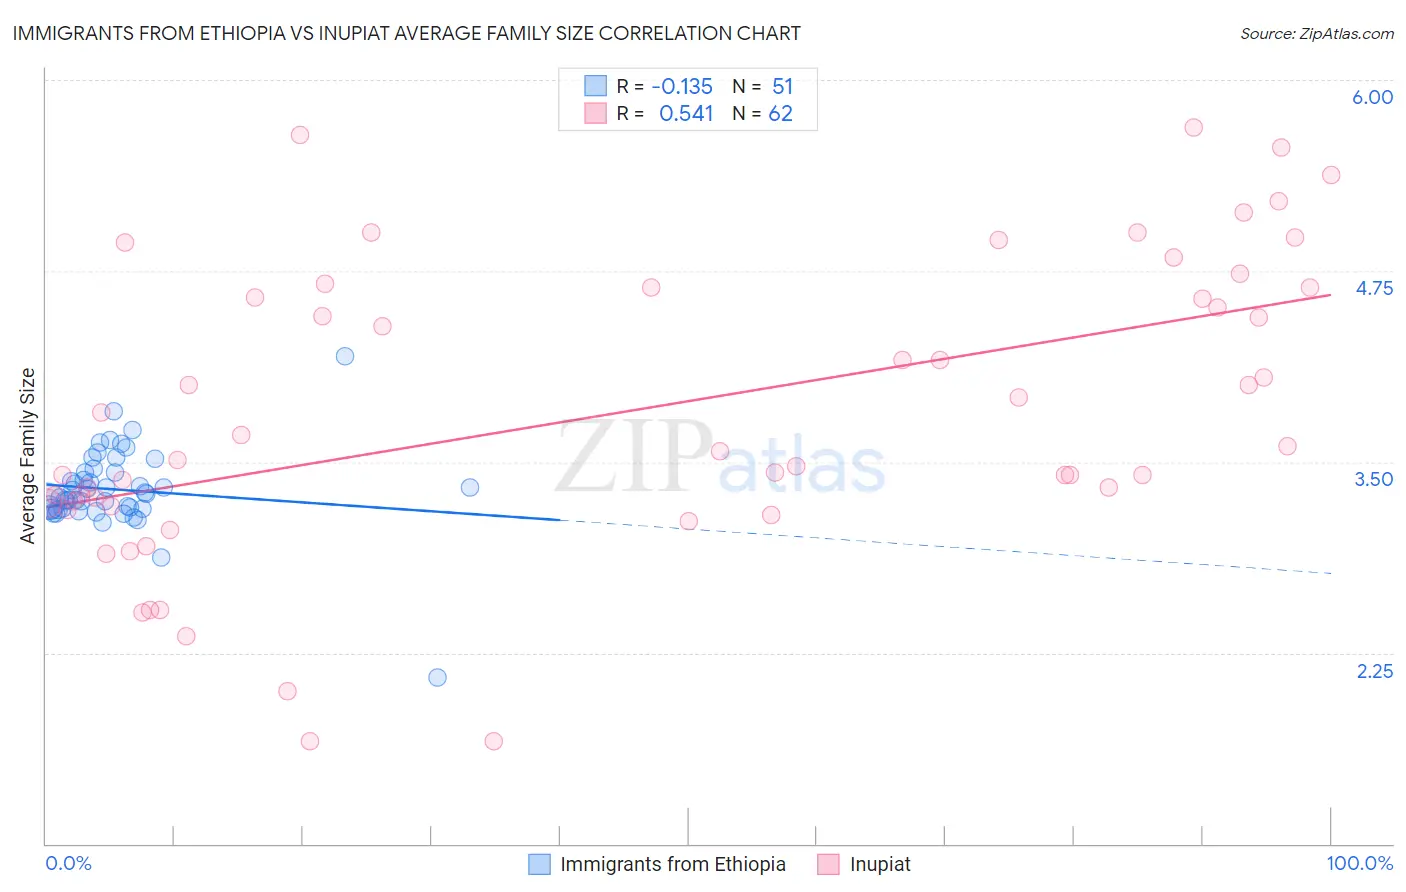
Immigrants from Ethiopia vs Inupiat Average Family Size Correlation Chart
The statistical analysis conducted on geographies consisting of 211,454,545 people shows a poor negative correlation between the proportion of Immigrants from Ethiopia and average family size in the United States with a correlation coefficient (R) of -0.135 and weighted average of 3.25. Similarly, the statistical analysis conducted on geographies consisting of 96,321,783 people shows a substantial positive correlation between the proportion of Inupiat and average family size in the United States with a correlation coefficient (R) of 0.541 and weighted average of 3.63, a difference of 11.6%.
Average Family Size Correlation Summary
| Measurement | Immigrants from Ethiopia | Inupiat |
| Minimum | 2.09 | 1.67 |
| Maximum | 4.19 | 5.69 |
| Range | 2.10 | 4.02 |
| Mean | 3.32 | 3.82 |
| Median | 3.29 | 3.58 |
| Interquartile 25% (IQ1) | 3.19 | 3.23 |
| Interquartile 75% (IQ3) | 3.43 | 4.64 |
| Interquartile Range (IQR) | 0.24 | 1.41 |
| Standard Deviation (Sample) | 0.28 | 0.97 |
| Standard Deviation (Population) | 0.28 | 0.96 |
Similar Demographics by Average Family Size
Demographics Similar to Immigrants from Ethiopia by Average Family Size
In terms of average family size, the demographic groups most similar to Immigrants from Ethiopia are Subsaharan African (3.25, a difference of 0.0%), Cuban (3.25, a difference of 0.010%), Venezuelan (3.25, a difference of 0.010%), Liberian (3.25, a difference of 0.010%), and Immigrants from Middle Africa (3.25, a difference of 0.020%).
| Demographics | Rating | Rank | Average Family Size |
| Costa Ricans | 86.8 /100 | #132 | Excellent 3.26 |
| Immigrants | Venezuela | 86.3 /100 | #133 | Excellent 3.26 |
| Africans | 84.9 /100 | #134 | Excellent 3.25 |
| Panamanians | 84.2 /100 | #135 | Excellent 3.25 |
| Comanche | 82.8 /100 | #136 | Excellent 3.25 |
| Immigrants | Middle Africa | 82.4 /100 | #137 | Excellent 3.25 |
| Cubans | 81.8 /100 | #138 | Excellent 3.25 |
| Immigrants | Ethiopia | 81.6 /100 | #139 | Excellent 3.25 |
| Sub-Saharan Africans | 81.6 /100 | #140 | Excellent 3.25 |
| Venezuelans | 81.4 /100 | #141 | Excellent 3.25 |
| Liberians | 81.2 /100 | #142 | Excellent 3.25 |
| Bhutanese | 81.0 /100 | #143 | Excellent 3.25 |
| Tsimshian | 80.2 /100 | #144 | Excellent 3.25 |
| Armenians | 78.2 /100 | #145 | Good 3.25 |
| Immigrants | Africa | 77.9 /100 | #146 | Good 3.25 |
Demographics Similar to Inupiat by Average Family Size
In terms of average family size, the demographic groups most similar to Inupiat are Arapaho (3.64, a difference of 0.22%), Navajo (3.65, a difference of 0.48%), Immigrants from Yemen (3.60, a difference of 0.87%), Hopi (3.60, a difference of 0.87%), and Spanish American Indian (3.58, a difference of 1.2%).
| Demographics | Rating | Rank | Average Family Size |
| Yup'ik | 100 /100 | #1 | Exceptional 4.00 |
| Crow | 100 /100 | #2 | Exceptional 3.82 |
| Pueblo | 100 /100 | #3 | Exceptional 3.79 |
| Pima | 100 /100 | #4 | Exceptional 3.75 |
| Navajo | 100.0 /100 | #5 | Exceptional 3.65 |
| Arapaho | 100.0 /100 | #6 | Exceptional 3.64 |
| Inupiat | 100.0 /100 | #7 | Exceptional 3.63 |
| Immigrants | Yemen | 100.0 /100 | #8 | Exceptional 3.60 |
| Hopi | 100.0 /100 | #9 | Exceptional 3.60 |
| Spanish American Indians | 100.0 /100 | #10 | Exceptional 3.58 |
| Tohono O'odham | 100.0 /100 | #11 | Exceptional 3.53 |
| Immigrants | Mexico | 100.0 /100 | #12 | Exceptional 3.52 |
| Sioux | 100.0 /100 | #13 | Exceptional 3.52 |
| Immigrants | Central America | 100.0 /100 | #14 | Exceptional 3.49 |
| Tongans | 100.0 /100 | #15 | Exceptional 3.49 |