Potawatomi vs Immigrants from Vietnam Average Family Size
COMPARE
Potawatomi
Immigrants from Vietnam
Average Family Size
Average Family Size Comparison
Potawatomi
Immigrants from Vietnam
3.16
AVERAGE FAMILY SIZE
1.3/ 100
METRIC RATING
259th/ 347
METRIC RANK
3.38
AVERAGE FAMILY SIZE
100.0/ 100
METRIC RATING
42nd/ 347
METRIC RANK
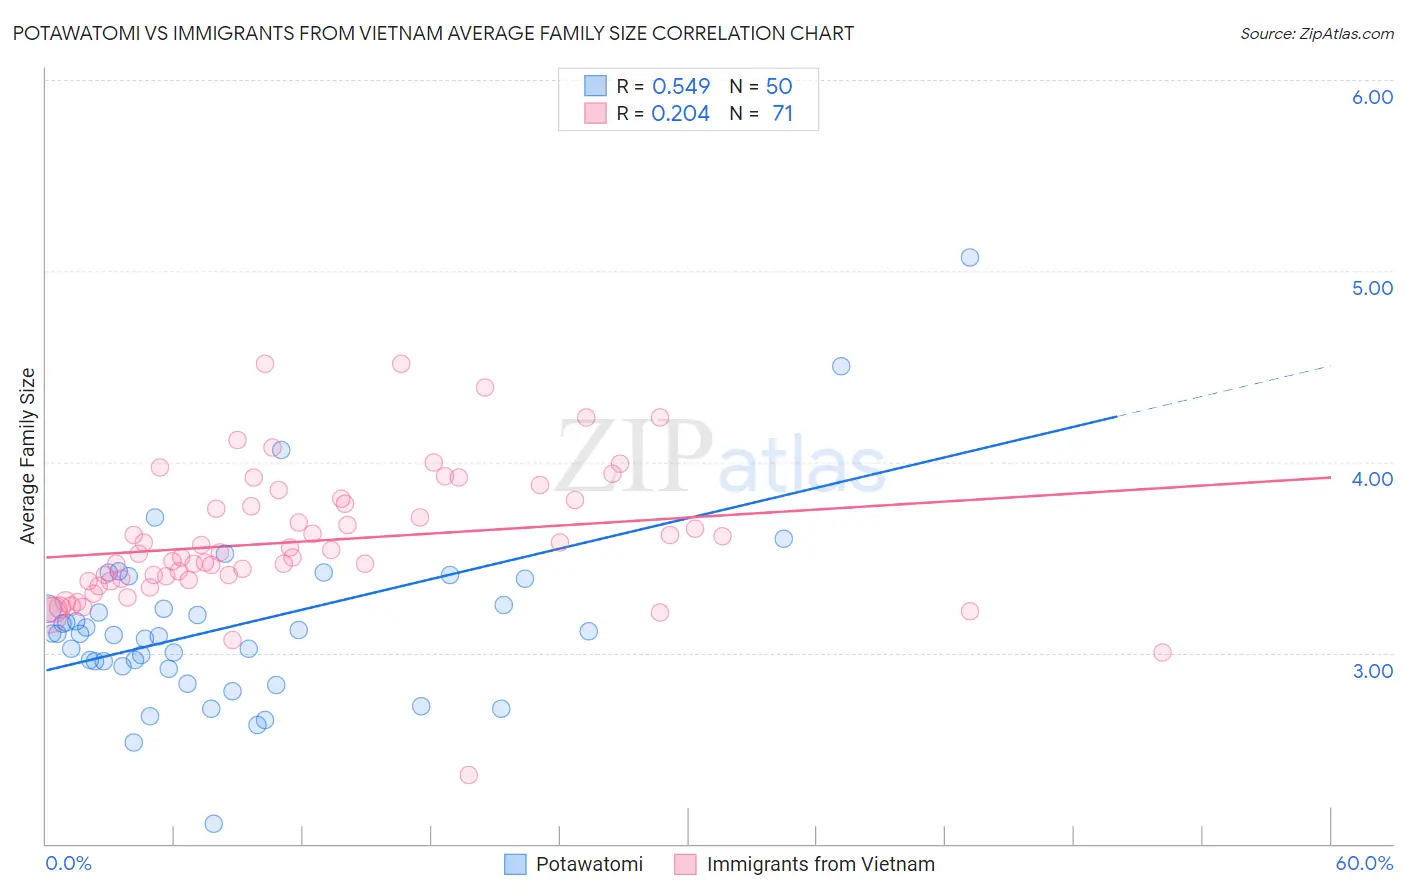
Potawatomi vs Immigrants from Vietnam Average Family Size Correlation Chart
The statistical analysis conducted on geographies consisting of 117,759,864 people shows a substantial positive correlation between the proportion of Potawatomi and average family size in the United States with a correlation coefficient (R) of 0.549 and weighted average of 3.16. Similarly, the statistical analysis conducted on geographies consisting of 404,558,006 people shows a weak positive correlation between the proportion of Immigrants from Vietnam and average family size in the United States with a correlation coefficient (R) of 0.204 and weighted average of 3.38, a difference of 6.8%.
Average Family Size Correlation Summary
| Measurement | Potawatomi | Immigrants from Vietnam |
| Minimum | 2.10 | 2.36 |
| Maximum | 5.07 | 4.52 |
| Range | 2.97 | 2.16 |
| Mean | 3.15 | 3.58 |
| Median | 3.10 | 3.52 |
| Interquartile 25% (IQ1) | 2.93 | 3.38 |
| Interquartile 75% (IQ3) | 3.25 | 3.80 |
| Interquartile Range (IQR) | 0.32 | 0.42 |
| Standard Deviation (Sample) | 0.47 | 0.36 |
| Standard Deviation (Population) | 0.47 | 0.36 |
Similar Demographics by Average Family Size
Demographics Similar to Potawatomi by Average Family Size
In terms of average family size, the demographic groups most similar to Potawatomi are Turkish (3.16, a difference of 0.0%), Immigrants from Albania (3.16, a difference of 0.0%), Immigrants from North Macedonia (3.16, a difference of 0.010%), Immigrants from Russia (3.16, a difference of 0.020%), and Albanian (3.17, a difference of 0.050%).
| Demographics | Rating | Rank | Average Family Size |
| Immigrants | Saudi Arabia | 1.7 /100 | #252 | Tragic 3.17 |
| South Africans | 1.7 /100 | #253 | Tragic 3.17 |
| Immigrants | Hungary | 1.7 /100 | #254 | Tragic 3.17 |
| Cape Verdeans | 1.6 /100 | #255 | Tragic 3.17 |
| Immigrants | Kazakhstan | 1.5 /100 | #256 | Tragic 3.17 |
| Albanians | 1.5 /100 | #257 | Tragic 3.17 |
| Turks | 1.3 /100 | #258 | Tragic 3.16 |
| Potawatomi | 1.3 /100 | #259 | Tragic 3.16 |
| Immigrants | Albania | 1.3 /100 | #260 | Tragic 3.16 |
| Immigrants | North Macedonia | 1.3 /100 | #261 | Tragic 3.16 |
| Immigrants | Russia | 1.3 /100 | #262 | Tragic 3.16 |
| Immigrants | Bulgaria | 1.0 /100 | #263 | Tragic 3.16 |
| Americans | 1.0 /100 | #264 | Tragic 3.16 |
| Immigrants | South Africa | 0.9 /100 | #265 | Tragic 3.16 |
| Immigrants | Greece | 0.9 /100 | #266 | Tragic 3.16 |
Demographics Similar to Immigrants from Vietnam by Average Family Size
In terms of average family size, the demographic groups most similar to Immigrants from Vietnam are Marshallese (3.38, a difference of 0.060%), Immigrants from Philippines (3.37, a difference of 0.10%), Alaska Native (3.37, a difference of 0.11%), Shoshone (3.37, a difference of 0.14%), and Haitian (3.37, a difference of 0.20%).
| Demographics | Rating | Rank | Average Family Size |
| Guatemalans | 100.0 /100 | #35 | Exceptional 3.40 |
| Immigrants | Guyana | 100.0 /100 | #36 | Exceptional 3.40 |
| Guyanese | 100.0 /100 | #37 | Exceptional 3.40 |
| Immigrants | Belize | 100.0 /100 | #38 | Exceptional 3.39 |
| Immigrants | Haiti | 100.0 /100 | #39 | Exceptional 3.39 |
| Belizeans | 100.0 /100 | #40 | Exceptional 3.39 |
| Marshallese | 100.0 /100 | #41 | Exceptional 3.38 |
| Immigrants | Vietnam | 100.0 /100 | #42 | Exceptional 3.38 |
| Immigrants | Philippines | 100.0 /100 | #43 | Exceptional 3.37 |
| Alaska Natives | 100.0 /100 | #44 | Exceptional 3.37 |
| Shoshone | 100.0 /100 | #45 | Exceptional 3.37 |
| Haitians | 100.0 /100 | #46 | Exceptional 3.37 |
| Vietnamese | 100.0 /100 | #47 | Exceptional 3.37 |
| Immigrants | Nicaragua | 100.0 /100 | #48 | Exceptional 3.37 |
| Bangladeshis | 100.0 /100 | #49 | Exceptional 3.37 |