Afghan vs Inupiat Average Family Size
COMPARE
Afghan
Inupiat
Average Family Size
Average Family Size Comparison
Afghans
Inupiat
3.31
AVERAGE FAMILY SIZE
99.7/ 100
METRIC RATING
85th/ 347
METRIC RANK
3.63
AVERAGE FAMILY SIZE
100.0/ 100
METRIC RATING
7th/ 347
METRIC RANK
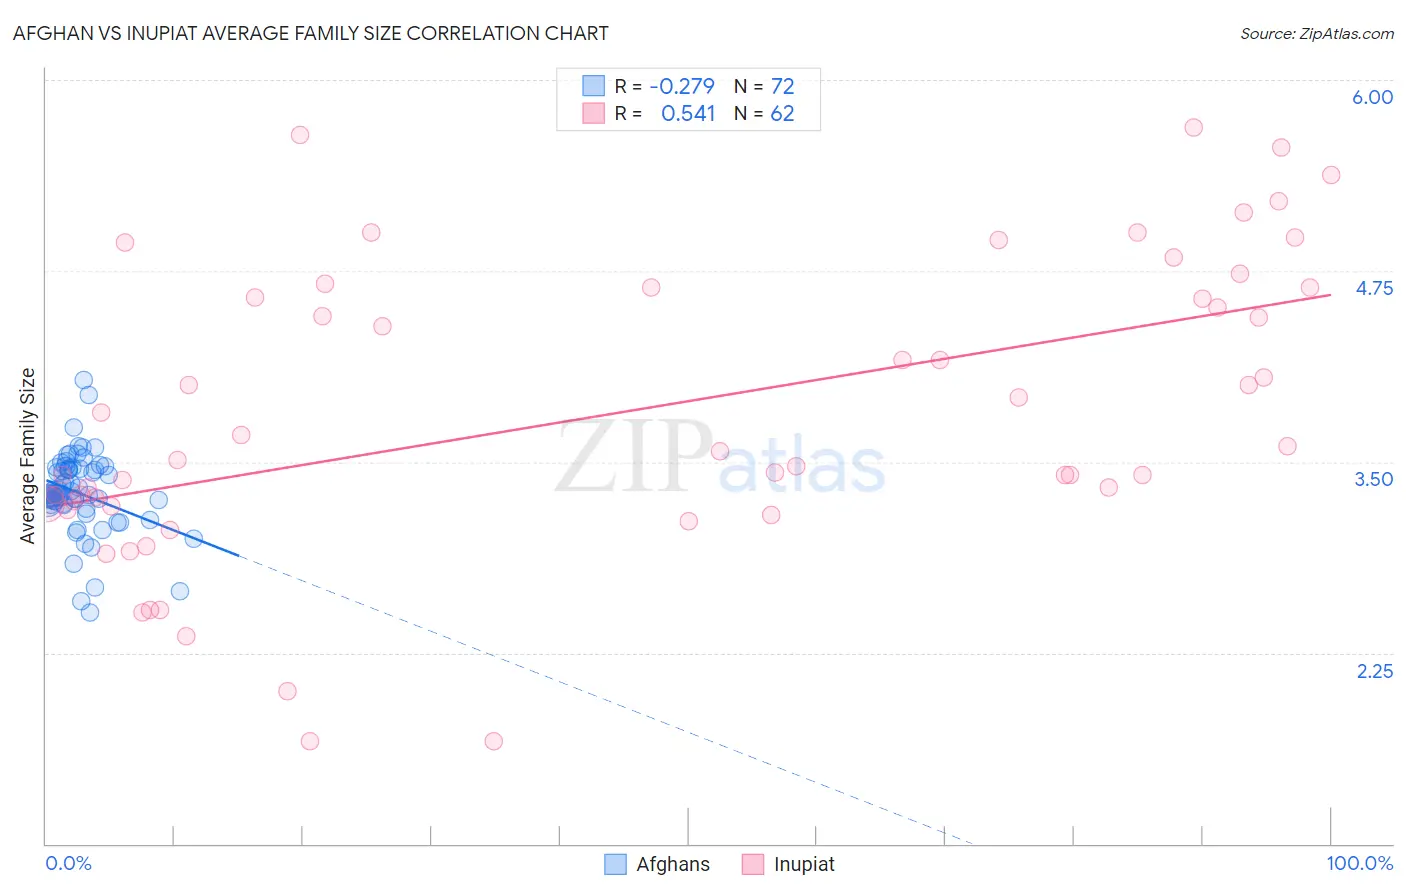
Afghan vs Inupiat Average Family Size Correlation Chart
The statistical analysis conducted on geographies consisting of 148,832,546 people shows a weak negative correlation between the proportion of Afghans and average family size in the United States with a correlation coefficient (R) of -0.279 and weighted average of 3.31. Similarly, the statistical analysis conducted on geographies consisting of 96,321,783 people shows a substantial positive correlation between the proportion of Inupiat and average family size in the United States with a correlation coefficient (R) of 0.541 and weighted average of 3.63, a difference of 9.5%.
Average Family Size Correlation Summary
| Measurement | Afghan | Inupiat |
| Minimum | 2.51 | 1.67 |
| Maximum | 4.04 | 5.69 |
| Range | 1.53 | 4.02 |
| Mean | 3.30 | 3.82 |
| Median | 3.29 | 3.58 |
| Interquartile 25% (IQ1) | 3.22 | 3.23 |
| Interquartile 75% (IQ3) | 3.46 | 4.64 |
| Interquartile Range (IQR) | 0.23 | 1.41 |
| Standard Deviation (Sample) | 0.26 | 0.97 |
| Standard Deviation (Population) | 0.26 | 0.96 |
Similar Demographics by Average Family Size
Demographics Similar to Afghans by Average Family Size
In terms of average family size, the demographic groups most similar to Afghans are Jamaican (3.31, a difference of 0.020%), Immigrants from Nigeria (3.32, a difference of 0.040%), Immigrants from Peru (3.31, a difference of 0.070%), Immigrants from Afghanistan (3.32, a difference of 0.080%), and Ecuadorian (3.32, a difference of 0.090%).
| Demographics | Rating | Rank | Average Family Size |
| Immigrants | Micronesia | 99.8 /100 | #78 | Exceptional 3.32 |
| British West Indians | 99.8 /100 | #79 | Exceptional 3.32 |
| Lumbee | 99.8 /100 | #80 | Exceptional 3.32 |
| Immigrants | Dominica | 99.8 /100 | #81 | Exceptional 3.32 |
| Ecuadorians | 99.8 /100 | #82 | Exceptional 3.32 |
| Immigrants | Afghanistan | 99.8 /100 | #83 | Exceptional 3.32 |
| Immigrants | Nigeria | 99.7 /100 | #84 | Exceptional 3.32 |
| Afghans | 99.7 /100 | #85 | Exceptional 3.31 |
| Jamaicans | 99.7 /100 | #86 | Exceptional 3.31 |
| Immigrants | Peru | 99.7 /100 | #87 | Exceptional 3.31 |
| Immigrants | Bolivia | 99.6 /100 | #88 | Exceptional 3.31 |
| Malaysians | 99.6 /100 | #89 | Exceptional 3.31 |
| Menominee | 99.4 /100 | #90 | Exceptional 3.30 |
| Immigrants | Pakistan | 99.2 /100 | #91 | Exceptional 3.30 |
| Immigrants | Cameroon | 99.2 /100 | #92 | Exceptional 3.30 |
Demographics Similar to Inupiat by Average Family Size
In terms of average family size, the demographic groups most similar to Inupiat are Arapaho (3.64, a difference of 0.22%), Navajo (3.65, a difference of 0.48%), Immigrants from Yemen (3.60, a difference of 0.87%), Hopi (3.60, a difference of 0.87%), and Spanish American Indian (3.58, a difference of 1.2%).
| Demographics | Rating | Rank | Average Family Size |
| Yup'ik | 100 /100 | #1 | Exceptional 4.00 |
| Crow | 100 /100 | #2 | Exceptional 3.82 |
| Pueblo | 100 /100 | #3 | Exceptional 3.79 |
| Pima | 100 /100 | #4 | Exceptional 3.75 |
| Navajo | 100.0 /100 | #5 | Exceptional 3.65 |
| Arapaho | 100.0 /100 | #6 | Exceptional 3.64 |
| Inupiat | 100.0 /100 | #7 | Exceptional 3.63 |
| Immigrants | Yemen | 100.0 /100 | #8 | Exceptional 3.60 |
| Hopi | 100.0 /100 | #9 | Exceptional 3.60 |
| Spanish American Indians | 100.0 /100 | #10 | Exceptional 3.58 |
| Tohono O'odham | 100.0 /100 | #11 | Exceptional 3.53 |
| Immigrants | Mexico | 100.0 /100 | #12 | Exceptional 3.52 |
| Sioux | 100.0 /100 | #13 | Exceptional 3.52 |
| Immigrants | Central America | 100.0 /100 | #14 | Exceptional 3.49 |
| Tongans | 100.0 /100 | #15 | Exceptional 3.49 |