Bulgarian vs Inupiat Average Family Size
COMPARE
Bulgarian
Inupiat
Average Family Size
Average Family Size Comparison
Bulgarians
Inupiat
3.13
AVERAGE FAMILY SIZE
0.1/ 100
METRIC RATING
313th/ 347
METRIC RANK
3.63
AVERAGE FAMILY SIZE
100.0/ 100
METRIC RATING
7th/ 347
METRIC RANK
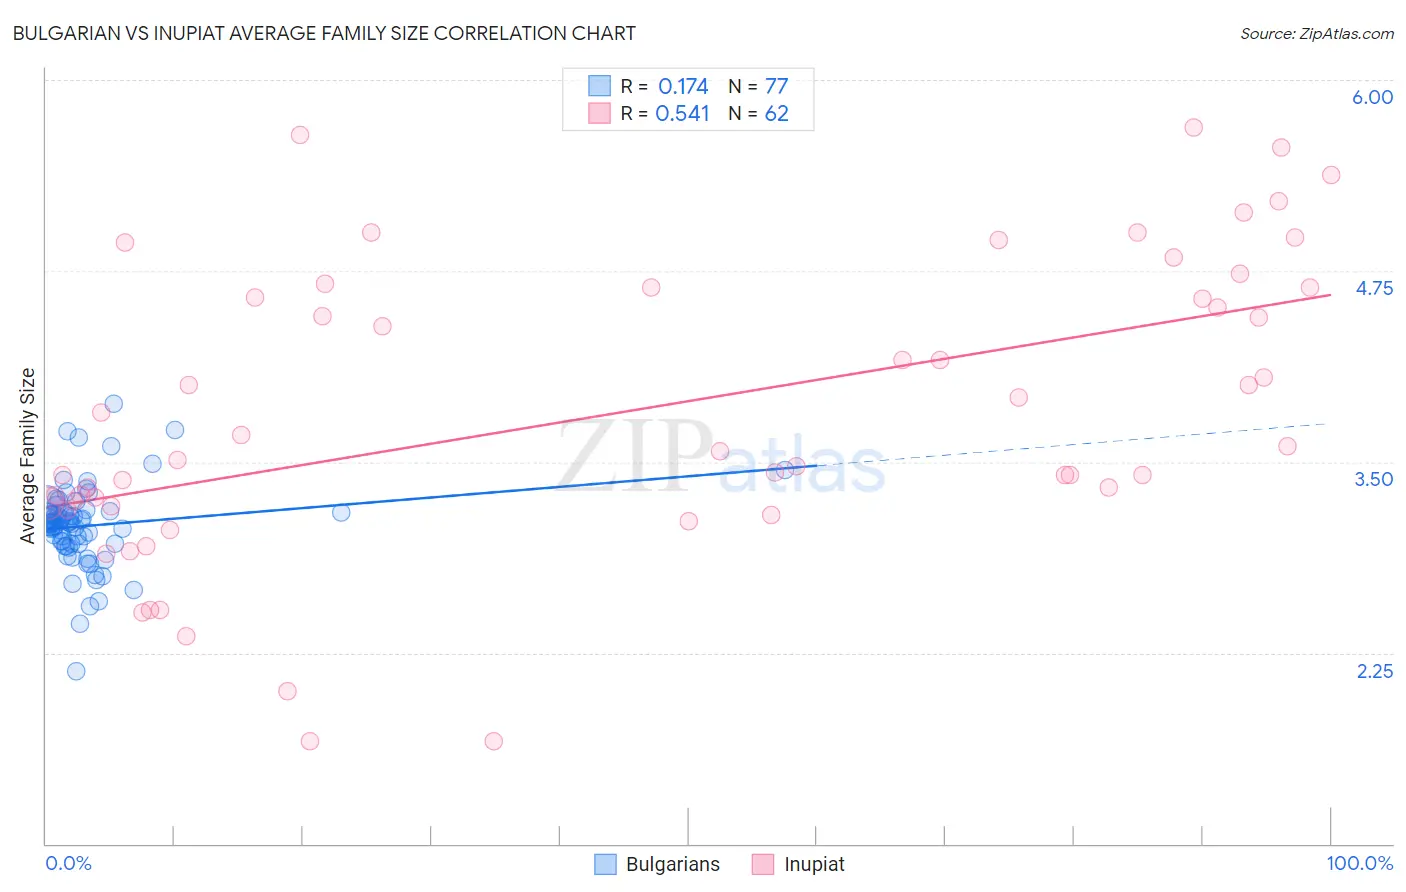
Bulgarian vs Inupiat Average Family Size Correlation Chart
The statistical analysis conducted on geographies consisting of 205,566,985 people shows a poor positive correlation between the proportion of Bulgarians and average family size in the United States with a correlation coefficient (R) of 0.174 and weighted average of 3.13. Similarly, the statistical analysis conducted on geographies consisting of 96,321,783 people shows a substantial positive correlation between the proportion of Inupiat and average family size in the United States with a correlation coefficient (R) of 0.541 and weighted average of 3.63, a difference of 16.1%.
Average Family Size Correlation Summary
| Measurement | Bulgarian | Inupiat |
| Minimum | 2.13 | 1.67 |
| Maximum | 3.88 | 5.69 |
| Range | 1.75 | 4.02 |
| Mean | 3.08 | 3.82 |
| Median | 3.09 | 3.58 |
| Interquartile 25% (IQ1) | 2.96 | 3.23 |
| Interquartile 75% (IQ3) | 3.17 | 4.64 |
| Interquartile Range (IQR) | 0.21 | 1.41 |
| Standard Deviation (Sample) | 0.28 | 0.97 |
| Standard Deviation (Population) | 0.27 | 0.96 |
Similar Demographics by Average Family Size
Demographics Similar to Bulgarians by Average Family Size
In terms of average family size, the demographic groups most similar to Bulgarians are Immigrants from Australia (3.13, a difference of 0.0%), Immigrants from Northern Europe (3.13, a difference of 0.030%), Russian (3.12, a difference of 0.040%), Immigrants from Scotland (3.12, a difference of 0.060%), and Czechoslovakian (3.13, a difference of 0.070%).
| Demographics | Rating | Rank | Average Family Size |
| Immigrants | Ireland | 0.1 /100 | #306 | Tragic 3.13 |
| Immigrants | Serbia | 0.1 /100 | #307 | Tragic 3.13 |
| Slavs | 0.1 /100 | #308 | Tragic 3.13 |
| Northern Europeans | 0.1 /100 | #309 | Tragic 3.13 |
| Czechoslovakians | 0.1 /100 | #310 | Tragic 3.13 |
| Immigrants | Northern Europe | 0.1 /100 | #311 | Tragic 3.13 |
| Immigrants | Australia | 0.1 /100 | #312 | Tragic 3.13 |
| Bulgarians | 0.1 /100 | #313 | Tragic 3.13 |
| Russians | 0.1 /100 | #314 | Tragic 3.12 |
| Immigrants | Scotland | 0.1 /100 | #315 | Tragic 3.12 |
| Serbians | 0.1 /100 | #316 | Tragic 3.12 |
| Italians | 0.1 /100 | #317 | Tragic 3.12 |
| Eastern Europeans | 0.1 /100 | #318 | Tragic 3.12 |
| Welsh | 0.1 /100 | #319 | Tragic 3.12 |
| Immigrants | North America | 0.0 /100 | #320 | Tragic 3.12 |
Demographics Similar to Inupiat by Average Family Size
In terms of average family size, the demographic groups most similar to Inupiat are Arapaho (3.64, a difference of 0.22%), Navajo (3.65, a difference of 0.48%), Immigrants from Yemen (3.60, a difference of 0.87%), Hopi (3.60, a difference of 0.87%), and Spanish American Indian (3.58, a difference of 1.2%).
| Demographics | Rating | Rank | Average Family Size |
| Yup'ik | 100 /100 | #1 | Exceptional 4.00 |
| Crow | 100 /100 | #2 | Exceptional 3.82 |
| Pueblo | 100 /100 | #3 | Exceptional 3.79 |
| Pima | 100 /100 | #4 | Exceptional 3.75 |
| Navajo | 100.0 /100 | #5 | Exceptional 3.65 |
| Arapaho | 100.0 /100 | #6 | Exceptional 3.64 |
| Inupiat | 100.0 /100 | #7 | Exceptional 3.63 |
| Immigrants | Yemen | 100.0 /100 | #8 | Exceptional 3.60 |
| Hopi | 100.0 /100 | #9 | Exceptional 3.60 |
| Spanish American Indians | 100.0 /100 | #10 | Exceptional 3.58 |
| Tohono O'odham | 100.0 /100 | #11 | Exceptional 3.53 |
| Immigrants | Mexico | 100.0 /100 | #12 | Exceptional 3.52 |
| Sioux | 100.0 /100 | #13 | Exceptional 3.52 |
| Immigrants | Central America | 100.0 /100 | #14 | Exceptional 3.49 |
| Tongans | 100.0 /100 | #15 | Exceptional 3.49 |