Indian (Asian) vs Immigrants from Vietnam Average Family Size
COMPARE
Indian (Asian)
Immigrants from Vietnam
Average Family Size
Average Family Size Comparison
Indians (Asian)
Immigrants from Vietnam
3.24
AVERAGE FAMILY SIZE
73.6/ 100
METRIC RATING
150th/ 347
METRIC RANK
3.38
AVERAGE FAMILY SIZE
100.0/ 100
METRIC RATING
42nd/ 347
METRIC RANK
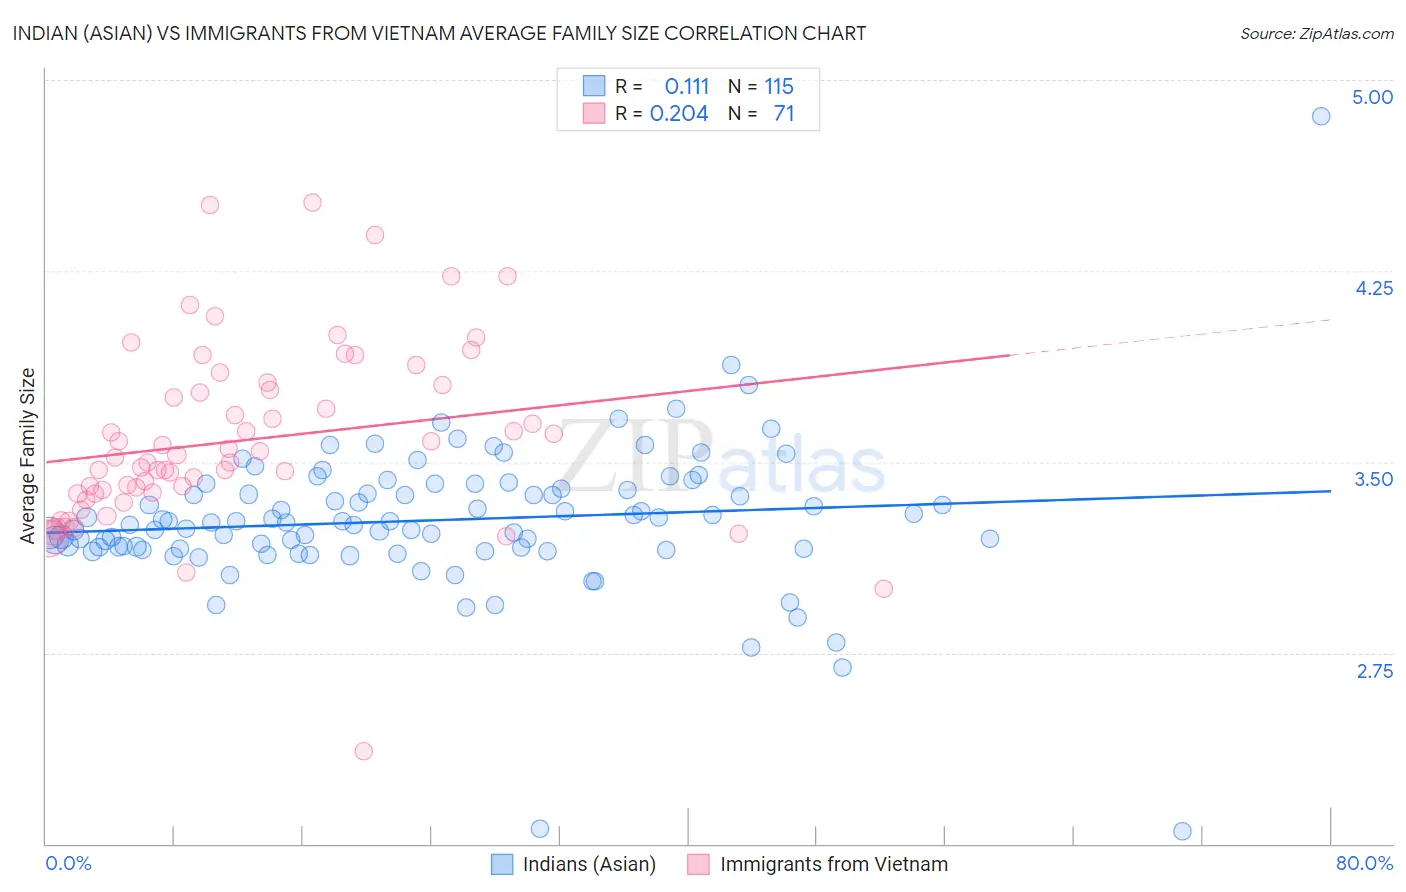
Indian (Asian) vs Immigrants from Vietnam Average Family Size Correlation Chart
The statistical analysis conducted on geographies consisting of 494,783,679 people shows a poor positive correlation between the proportion of Indians (Asian) and average family size in the United States with a correlation coefficient (R) of 0.111 and weighted average of 3.24. Similarly, the statistical analysis conducted on geographies consisting of 404,558,006 people shows a weak positive correlation between the proportion of Immigrants from Vietnam and average family size in the United States with a correlation coefficient (R) of 0.204 and weighted average of 3.38, a difference of 4.2%.
Average Family Size Correlation Summary
| Measurement | Indian (Asian) | Immigrants from Vietnam |
| Minimum | 2.05 | 2.36 |
| Maximum | 4.86 | 4.52 |
| Range | 2.81 | 2.16 |
| Mean | 3.27 | 3.58 |
| Median | 3.26 | 3.52 |
| Interquartile 25% (IQ1) | 3.16 | 3.38 |
| Interquartile 75% (IQ3) | 3.40 | 3.80 |
| Interquartile Range (IQR) | 0.24 | 0.42 |
| Standard Deviation (Sample) | 0.30 | 0.36 |
| Standard Deviation (Population) | 0.29 | 0.36 |
Similar Demographics by Average Family Size
Demographics Similar to Indians (Asian) by Average Family Size
In terms of average family size, the demographic groups most similar to Indians (Asian) are Assyrian/Chaldean/Syriac (3.24, a difference of 0.0%), Jordanian (3.24, a difference of 0.0%), Blackfeet (3.24, a difference of 0.030%), Spanish American (3.24, a difference of 0.030%), and Immigrants from Jordan (3.24, a difference of 0.050%).
| Demographics | Rating | Rank | Average Family Size |
| Bhutanese | 81.0 /100 | #143 | Excellent 3.25 |
| Tsimshian | 80.2 /100 | #144 | Excellent 3.25 |
| Armenians | 78.2 /100 | #145 | Good 3.25 |
| Immigrants | Africa | 77.9 /100 | #146 | Good 3.25 |
| Immigrants | Jordan | 75.7 /100 | #147 | Good 3.24 |
| Blackfeet | 75.0 /100 | #148 | Good 3.24 |
| Assyrians/Chaldeans/Syriacs | 73.8 /100 | #149 | Good 3.24 |
| Indians (Asian) | 73.6 /100 | #150 | Good 3.24 |
| Jordanians | 73.5 /100 | #151 | Good 3.24 |
| Spanish Americans | 72.5 /100 | #152 | Good 3.24 |
| Immigrants | Eritrea | 71.4 /100 | #153 | Good 3.24 |
| Immigrants | Egypt | 70.0 /100 | #154 | Good 3.24 |
| Seminole | 68.2 /100 | #155 | Good 3.24 |
| Immigrants | Taiwan | 68.1 /100 | #156 | Good 3.24 |
| Immigrants | Uzbekistan | 67.0 /100 | #157 | Good 3.24 |
Demographics Similar to Immigrants from Vietnam by Average Family Size
In terms of average family size, the demographic groups most similar to Immigrants from Vietnam are Marshallese (3.38, a difference of 0.060%), Immigrants from Philippines (3.37, a difference of 0.10%), Alaska Native (3.37, a difference of 0.11%), Shoshone (3.37, a difference of 0.14%), and Haitian (3.37, a difference of 0.20%).
| Demographics | Rating | Rank | Average Family Size |
| Guatemalans | 100.0 /100 | #35 | Exceptional 3.40 |
| Immigrants | Guyana | 100.0 /100 | #36 | Exceptional 3.40 |
| Guyanese | 100.0 /100 | #37 | Exceptional 3.40 |
| Immigrants | Belize | 100.0 /100 | #38 | Exceptional 3.39 |
| Immigrants | Haiti | 100.0 /100 | #39 | Exceptional 3.39 |
| Belizeans | 100.0 /100 | #40 | Exceptional 3.39 |
| Marshallese | 100.0 /100 | #41 | Exceptional 3.38 |
| Immigrants | Vietnam | 100.0 /100 | #42 | Exceptional 3.38 |
| Immigrants | Philippines | 100.0 /100 | #43 | Exceptional 3.37 |
| Alaska Natives | 100.0 /100 | #44 | Exceptional 3.37 |
| Shoshone | 100.0 /100 | #45 | Exceptional 3.37 |
| Haitians | 100.0 /100 | #46 | Exceptional 3.37 |
| Vietnamese | 100.0 /100 | #47 | Exceptional 3.37 |
| Immigrants | Nicaragua | 100.0 /100 | #48 | Exceptional 3.37 |
| Bangladeshis | 100.0 /100 | #49 | Exceptional 3.37 |