Immigrants from Russia vs Immigrants from Vietnam Average Family Size
COMPARE
Immigrants from Russia
Immigrants from Vietnam
Average Family Size
Average Family Size Comparison
Immigrants from Russia
Immigrants from Vietnam
3.16
AVERAGE FAMILY SIZE
1.3/ 100
METRIC RATING
262nd/ 347
METRIC RANK
3.38
AVERAGE FAMILY SIZE
100.0/ 100
METRIC RATING
42nd/ 347
METRIC RANK
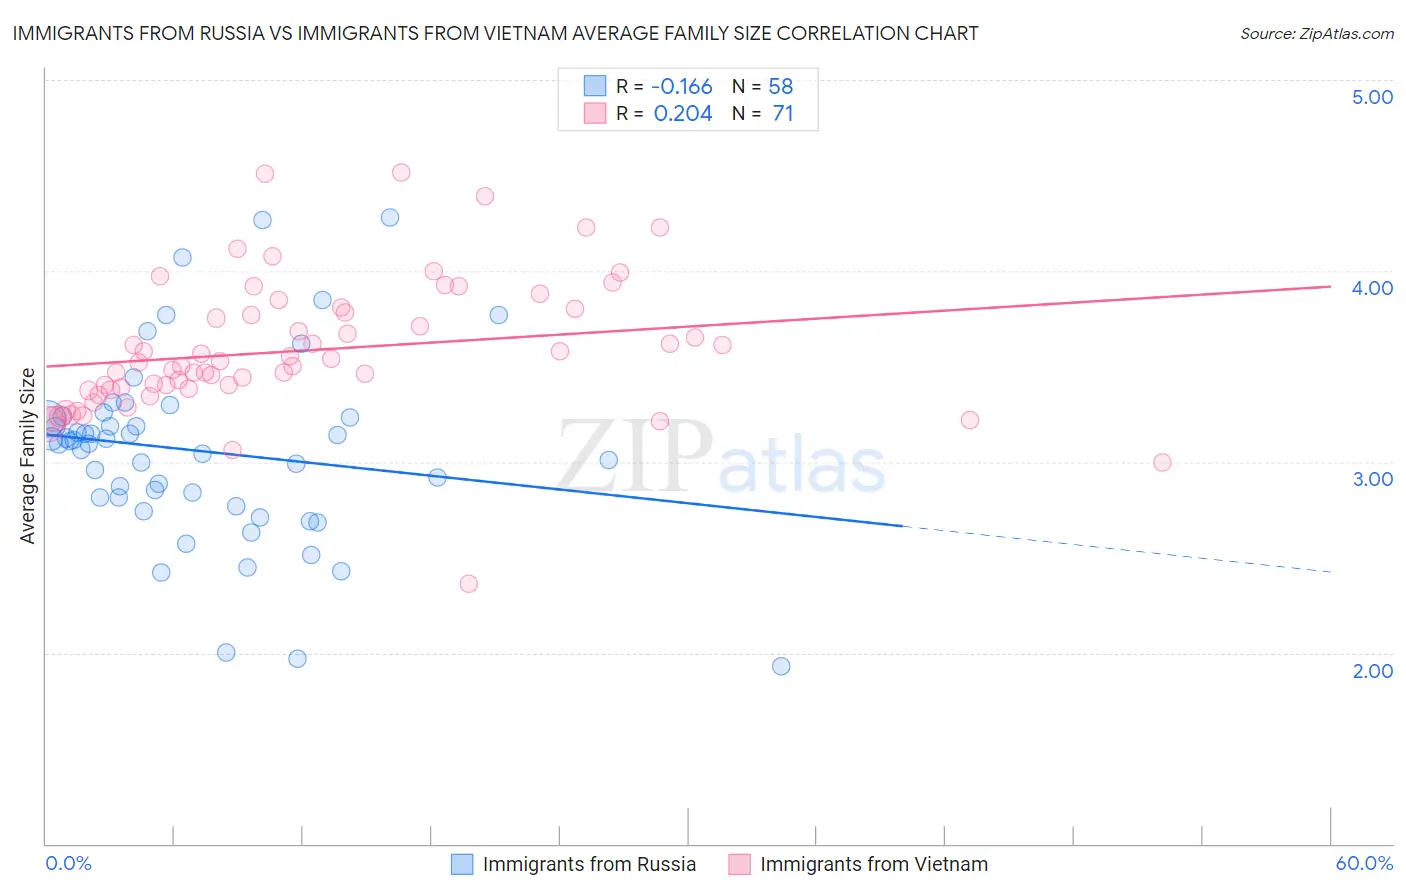
Immigrants from Russia vs Immigrants from Vietnam Average Family Size Correlation Chart
The statistical analysis conducted on geographies consisting of 347,722,348 people shows a poor negative correlation between the proportion of Immigrants from Russia and average family size in the United States with a correlation coefficient (R) of -0.166 and weighted average of 3.16. Similarly, the statistical analysis conducted on geographies consisting of 404,558,006 people shows a weak positive correlation between the proportion of Immigrants from Vietnam and average family size in the United States with a correlation coefficient (R) of 0.204 and weighted average of 3.38, a difference of 6.8%.
Average Family Size Correlation Summary
| Measurement | Immigrants from Russia | Immigrants from Vietnam |
| Minimum | 1.93 | 2.36 |
| Maximum | 4.28 | 4.52 |
| Range | 2.35 | 2.16 |
| Mean | 3.06 | 3.58 |
| Median | 3.10 | 3.52 |
| Interquartile 25% (IQ1) | 2.81 | 3.38 |
| Interquartile 75% (IQ3) | 3.23 | 3.80 |
| Interquartile Range (IQR) | 0.42 | 0.42 |
| Standard Deviation (Sample) | 0.48 | 0.36 |
| Standard Deviation (Population) | 0.48 | 0.36 |
Similar Demographics by Average Family Size
Demographics Similar to Immigrants from Russia by Average Family Size
In terms of average family size, the demographic groups most similar to Immigrants from Russia are Immigrants from Albania (3.16, a difference of 0.010%), Immigrants from North Macedonia (3.16, a difference of 0.010%), Turkish (3.16, a difference of 0.020%), Potawatomi (3.16, a difference of 0.020%), and Albanian (3.17, a difference of 0.070%).
| Demographics | Rating | Rank | Average Family Size |
| Cape Verdeans | 1.6 /100 | #255 | Tragic 3.17 |
| Immigrants | Kazakhstan | 1.5 /100 | #256 | Tragic 3.17 |
| Albanians | 1.5 /100 | #257 | Tragic 3.17 |
| Turks | 1.3 /100 | #258 | Tragic 3.16 |
| Potawatomi | 1.3 /100 | #259 | Tragic 3.16 |
| Immigrants | Albania | 1.3 /100 | #260 | Tragic 3.16 |
| Immigrants | North Macedonia | 1.3 /100 | #261 | Tragic 3.16 |
| Immigrants | Russia | 1.3 /100 | #262 | Tragic 3.16 |
| Immigrants | Bulgaria | 1.0 /100 | #263 | Tragic 3.16 |
| Americans | 1.0 /100 | #264 | Tragic 3.16 |
| Immigrants | South Africa | 0.9 /100 | #265 | Tragic 3.16 |
| Immigrants | Greece | 0.9 /100 | #266 | Tragic 3.16 |
| Iroquois | 0.8 /100 | #267 | Tragic 3.16 |
| Maltese | 0.8 /100 | #268 | Tragic 3.16 |
| Immigrants | Singapore | 0.7 /100 | #269 | Tragic 3.16 |
Demographics Similar to Immigrants from Vietnam by Average Family Size
In terms of average family size, the demographic groups most similar to Immigrants from Vietnam are Marshallese (3.38, a difference of 0.060%), Immigrants from Philippines (3.37, a difference of 0.10%), Alaska Native (3.37, a difference of 0.11%), Shoshone (3.37, a difference of 0.14%), and Haitian (3.37, a difference of 0.20%).
| Demographics | Rating | Rank | Average Family Size |
| Guatemalans | 100.0 /100 | #35 | Exceptional 3.40 |
| Immigrants | Guyana | 100.0 /100 | #36 | Exceptional 3.40 |
| Guyanese | 100.0 /100 | #37 | Exceptional 3.40 |
| Immigrants | Belize | 100.0 /100 | #38 | Exceptional 3.39 |
| Immigrants | Haiti | 100.0 /100 | #39 | Exceptional 3.39 |
| Belizeans | 100.0 /100 | #40 | Exceptional 3.39 |
| Marshallese | 100.0 /100 | #41 | Exceptional 3.38 |
| Immigrants | Vietnam | 100.0 /100 | #42 | Exceptional 3.38 |
| Immigrants | Philippines | 100.0 /100 | #43 | Exceptional 3.37 |
| Alaska Natives | 100.0 /100 | #44 | Exceptional 3.37 |
| Shoshone | 100.0 /100 | #45 | Exceptional 3.37 |
| Haitians | 100.0 /100 | #46 | Exceptional 3.37 |
| Vietnamese | 100.0 /100 | #47 | Exceptional 3.37 |
| Immigrants | Nicaragua | 100.0 /100 | #48 | Exceptional 3.37 |
| Bangladeshis | 100.0 /100 | #49 | Exceptional 3.37 |