Belizean vs Immigrants from Vietnam Average Family Size
COMPARE
Belizean
Immigrants from Vietnam
Average Family Size
Average Family Size Comparison
Belizeans
Immigrants from Vietnam
3.39
AVERAGE FAMILY SIZE
100.0/ 100
METRIC RATING
40th/ 347
METRIC RANK
3.38
AVERAGE FAMILY SIZE
100.0/ 100
METRIC RATING
42nd/ 347
METRIC RANK
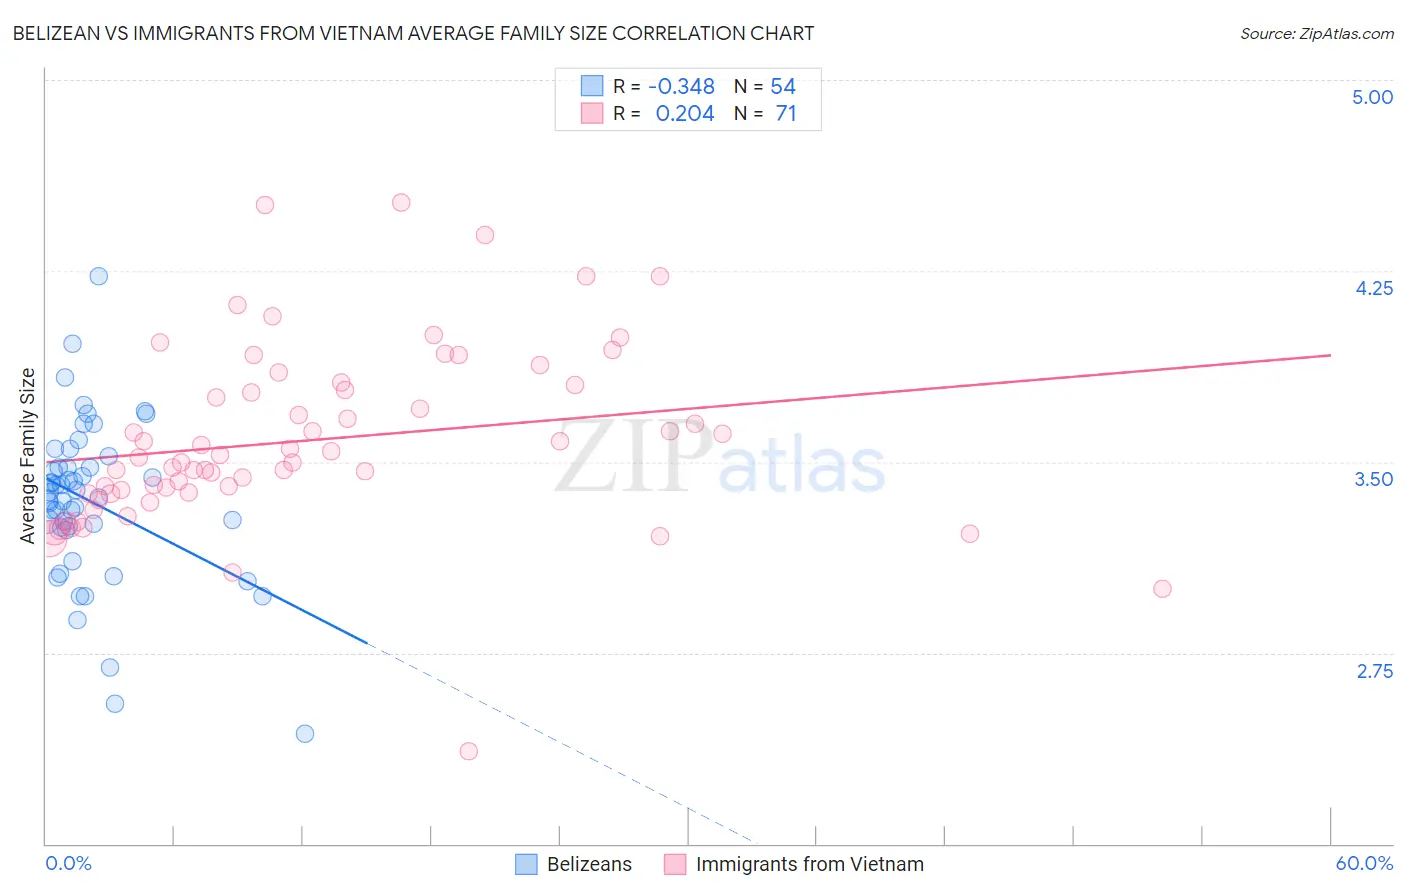
Belizean vs Immigrants from Vietnam Average Family Size Correlation Chart
The statistical analysis conducted on geographies consisting of 144,152,249 people shows a mild negative correlation between the proportion of Belizeans and average family size in the United States with a correlation coefficient (R) of -0.348 and weighted average of 3.39. Similarly, the statistical analysis conducted on geographies consisting of 404,558,006 people shows a weak positive correlation between the proportion of Immigrants from Vietnam and average family size in the United States with a correlation coefficient (R) of 0.204 and weighted average of 3.38, a difference of 0.23%.
Average Family Size Correlation Summary
| Measurement | Belizean | Immigrants from Vietnam |
| Minimum | 2.43 | 2.36 |
| Maximum | 4.23 | 4.52 |
| Range | 1.80 | 2.16 |
| Mean | 3.34 | 3.58 |
| Median | 3.37 | 3.52 |
| Interquartile 25% (IQ1) | 3.24 | 3.38 |
| Interquartile 75% (IQ3) | 3.48 | 3.80 |
| Interquartile Range (IQR) | 0.24 | 0.42 |
| Standard Deviation (Sample) | 0.32 | 0.36 |
| Standard Deviation (Population) | 0.32 | 0.36 |
Demographics Similar to Belizeans and Immigrants from Vietnam by Average Family Size
In terms of average family size, the demographic groups most similar to Belizeans are Immigrants from Haiti (3.39, a difference of 0.12%), Marshallese (3.38, a difference of 0.17%), Immigrants from Belize (3.39, a difference of 0.20%), Immigrants from Philippines (3.37, a difference of 0.33%), and Alaska Native (3.37, a difference of 0.34%). Similarly, the demographic groups most similar to Immigrants from Vietnam are Marshallese (3.38, a difference of 0.060%), Immigrants from Philippines (3.37, a difference of 0.10%), Alaska Native (3.37, a difference of 0.11%), Shoshone (3.37, a difference of 0.14%), and Haitian (3.37, a difference of 0.20%).
| Demographics | Rating | Rank | Average Family Size |
| Central Americans | 100.0 /100 | #31 | Exceptional 3.41 |
| Immigrants | Guatemala | 100.0 /100 | #32 | Exceptional 3.41 |
| Hawaiians | 100.0 /100 | #33 | Exceptional 3.41 |
| Hispanics or Latinos | 100.0 /100 | #34 | Exceptional 3.41 |
| Guatemalans | 100.0 /100 | #35 | Exceptional 3.40 |
| Immigrants | Guyana | 100.0 /100 | #36 | Exceptional 3.40 |
| Guyanese | 100.0 /100 | #37 | Exceptional 3.40 |
| Immigrants | Belize | 100.0 /100 | #38 | Exceptional 3.39 |
| Immigrants | Haiti | 100.0 /100 | #39 | Exceptional 3.39 |
| Belizeans | 100.0 /100 | #40 | Exceptional 3.39 |
| Marshallese | 100.0 /100 | #41 | Exceptional 3.38 |
| Immigrants | Vietnam | 100.0 /100 | #42 | Exceptional 3.38 |
| Immigrants | Philippines | 100.0 /100 | #43 | Exceptional 3.37 |
| Alaska Natives | 100.0 /100 | #44 | Exceptional 3.37 |
| Shoshone | 100.0 /100 | #45 | Exceptional 3.37 |
| Haitians | 100.0 /100 | #46 | Exceptional 3.37 |
| Vietnamese | 100.0 /100 | #47 | Exceptional 3.37 |
| Immigrants | Nicaragua | 100.0 /100 | #48 | Exceptional 3.37 |
| Bangladeshis | 100.0 /100 | #49 | Exceptional 3.37 |
| Immigrants | Bangladesh | 100.0 /100 | #50 | Exceptional 3.36 |
| Nicaraguans | 100.0 /100 | #51 | Exceptional 3.36 |