Central American Indian vs Immigrants from Vietnam Average Family Size
COMPARE
Central American Indian
Immigrants from Vietnam
Average Family Size
Average Family Size Comparison
Central American Indians
Immigrants from Vietnam
3.35
AVERAGE FAMILY SIZE
100.0/ 100
METRIC RATING
61st/ 347
METRIC RANK
3.38
AVERAGE FAMILY SIZE
100.0/ 100
METRIC RATING
42nd/ 347
METRIC RANK
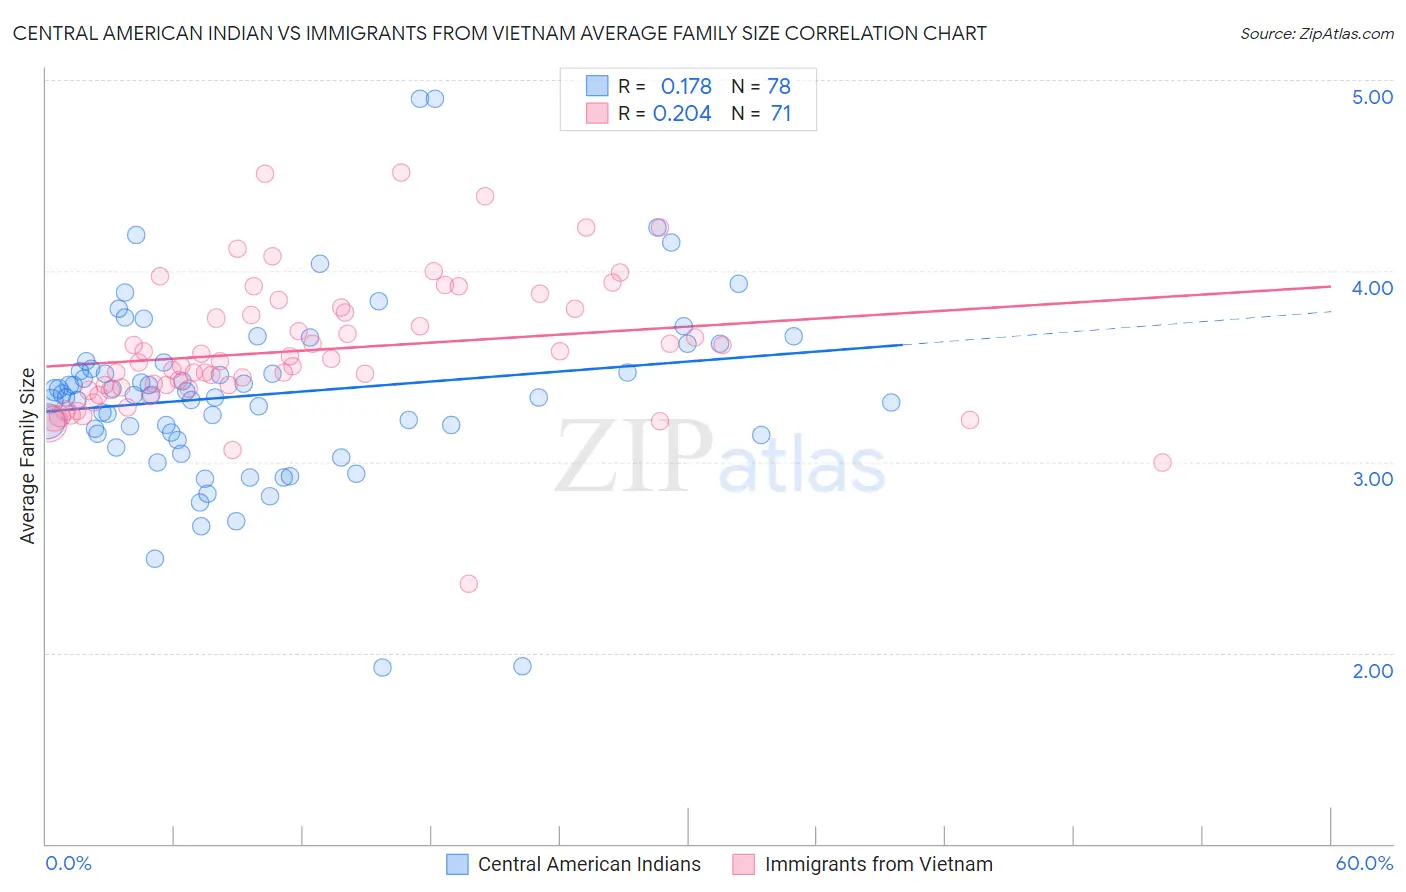
Central American Indian vs Immigrants from Vietnam Average Family Size Correlation Chart
The statistical analysis conducted on geographies consisting of 326,061,161 people shows a poor positive correlation between the proportion of Central American Indians and average family size in the United States with a correlation coefficient (R) of 0.178 and weighted average of 3.35. Similarly, the statistical analysis conducted on geographies consisting of 404,558,006 people shows a weak positive correlation between the proportion of Immigrants from Vietnam and average family size in the United States with a correlation coefficient (R) of 0.204 and weighted average of 3.38, a difference of 0.94%.
Average Family Size Correlation Summary
| Measurement | Central American Indian | Immigrants from Vietnam |
| Minimum | 1.92 | 2.36 |
| Maximum | 4.90 | 4.52 |
| Range | 2.98 | 2.16 |
| Mean | 3.35 | 3.58 |
| Median | 3.35 | 3.52 |
| Interquartile 25% (IQ1) | 3.15 | 3.38 |
| Interquartile 75% (IQ3) | 3.52 | 3.80 |
| Interquartile Range (IQR) | 0.37 | 0.42 |
| Standard Deviation (Sample) | 0.48 | 0.36 |
| Standard Deviation (Population) | 0.48 | 0.36 |
Demographics Similar to Central American Indians and Immigrants from Vietnam by Average Family Size
In terms of average family size, the demographic groups most similar to Central American Indians are Immigrants from Armenia (3.35, a difference of 0.030%), Japanese (3.35, a difference of 0.050%), Honduran (3.35, a difference of 0.14%), Sri Lankan (3.35, a difference of 0.15%), and Immigrants from Dominican Republic (3.35, a difference of 0.21%). Similarly, the demographic groups most similar to Immigrants from Vietnam are Marshallese (3.38, a difference of 0.060%), Immigrants from Philippines (3.37, a difference of 0.10%), Alaska Native (3.37, a difference of 0.11%), Shoshone (3.37, a difference of 0.14%), and Haitian (3.37, a difference of 0.20%).
| Demographics | Rating | Rank | Average Family Size |
| Marshallese | 100.0 /100 | #41 | Exceptional 3.38 |
| Immigrants | Vietnam | 100.0 /100 | #42 | Exceptional 3.38 |
| Immigrants | Philippines | 100.0 /100 | #43 | Exceptional 3.37 |
| Alaska Natives | 100.0 /100 | #44 | Exceptional 3.37 |
| Shoshone | 100.0 /100 | #45 | Exceptional 3.37 |
| Haitians | 100.0 /100 | #46 | Exceptional 3.37 |
| Vietnamese | 100.0 /100 | #47 | Exceptional 3.37 |
| Immigrants | Nicaragua | 100.0 /100 | #48 | Exceptional 3.37 |
| Bangladeshis | 100.0 /100 | #49 | Exceptional 3.37 |
| Immigrants | Bangladesh | 100.0 /100 | #50 | Exceptional 3.36 |
| Nicaraguans | 100.0 /100 | #51 | Exceptional 3.36 |
| Fijians | 100.0 /100 | #52 | Exceptional 3.36 |
| Koreans | 100.0 /100 | #53 | Exceptional 3.36 |
| Immigrants | South Eastern Asia | 100.0 /100 | #54 | Exceptional 3.36 |
| Immigrants | Honduras | 100.0 /100 | #55 | Exceptional 3.36 |
| Immigrants | Dominican Republic | 100.0 /100 | #56 | Exceptional 3.35 |
| Sri Lankans | 100.0 /100 | #57 | Exceptional 3.35 |
| Hondurans | 100.0 /100 | #58 | Exceptional 3.35 |
| Japanese | 100.0 /100 | #59 | Exceptional 3.35 |
| Immigrants | Armenia | 100.0 /100 | #60 | Exceptional 3.35 |
| Central American Indians | 100.0 /100 | #61 | Exceptional 3.35 |