Polish vs Salvadoran Average Family Size
COMPARE
Polish
Salvadoran
Average Family Size
Average Family Size Comparison
Poles
Salvadorans
3.09
AVERAGE FAMILY SIZE
0.0/ 100
METRIC RATING
341st/ 347
METRIC RANK
3.48
AVERAGE FAMILY SIZE
100.0/ 100
METRIC RATING
18th/ 347
METRIC RANK
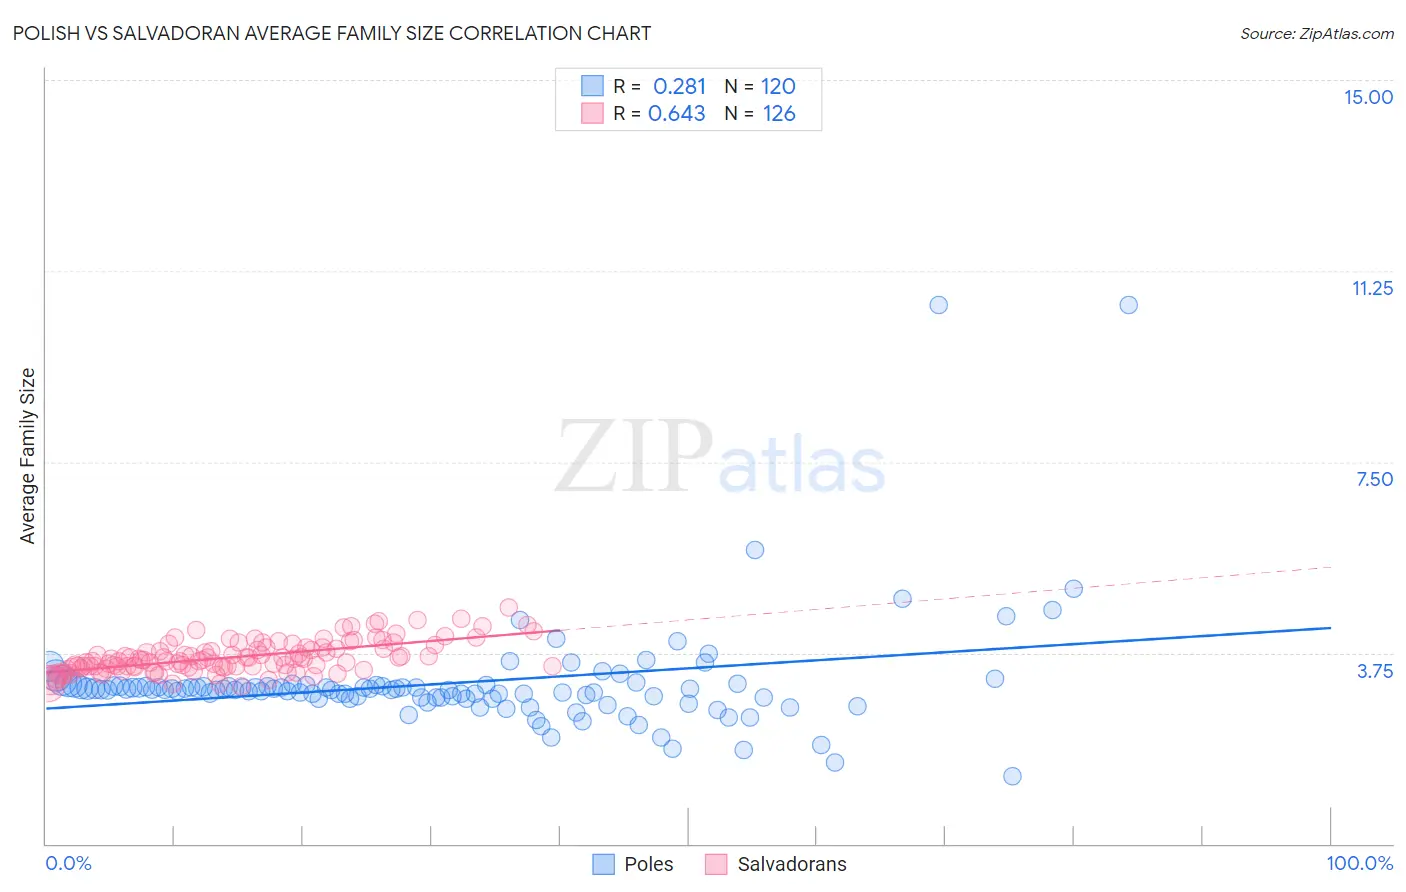
Polish vs Salvadoran Average Family Size Correlation Chart
The statistical analysis conducted on geographies consisting of 559,976,913 people shows a weak positive correlation between the proportion of Poles and average family size in the United States with a correlation coefficient (R) of 0.281 and weighted average of 3.09. Similarly, the statistical analysis conducted on geographies consisting of 398,698,929 people shows a significant positive correlation between the proportion of Salvadorans and average family size in the United States with a correlation coefficient (R) of 0.643 and weighted average of 3.48, a difference of 12.5%.
Average Family Size Correlation Summary
| Measurement | Polish | Salvadoran |
| Minimum | 1.32 | 3.10 |
| Maximum | 10.58 | 4.63 |
| Range | 9.26 | 1.53 |
| Mean | 3.15 | 3.67 |
| Median | 3.03 | 3.62 |
| Interquartile 25% (IQ1) | 2.87 | 3.47 |
| Interquartile 75% (IQ3) | 3.10 | 3.85 |
| Interquartile Range (IQR) | 0.23 | 0.37 |
| Standard Deviation (Sample) | 1.13 | 0.31 |
| Standard Deviation (Population) | 1.13 | 0.31 |
Similar Demographics by Average Family Size
Demographics Similar to Poles by Average Family Size
In terms of average family size, the demographic groups most similar to Poles are Finnish (3.09, a difference of 0.050%), German (3.09, a difference of 0.14%), Croatian (3.10, a difference of 0.19%), French (3.10, a difference of 0.21%), and Swedish (3.10, a difference of 0.23%).
| Demographics | Rating | Rank | Average Family Size |
| Estonians | 0.0 /100 | #333 | Tragic 3.10 |
| Lithuanians | 0.0 /100 | #334 | Tragic 3.10 |
| Luxembourgers | 0.0 /100 | #335 | Tragic 3.10 |
| Irish | 0.0 /100 | #336 | Tragic 3.10 |
| Swedes | 0.0 /100 | #337 | Tragic 3.10 |
| French | 0.0 /100 | #338 | Tragic 3.10 |
| Croatians | 0.0 /100 | #339 | Tragic 3.10 |
| Finns | 0.0 /100 | #340 | Tragic 3.09 |
| Poles | 0.0 /100 | #341 | Tragic 3.09 |
| Germans | 0.0 /100 | #342 | Tragic 3.09 |
| Norwegians | 0.0 /100 | #343 | Tragic 3.08 |
| French Canadians | 0.0 /100 | #344 | Tragic 3.07 |
| Slovenes | 0.0 /100 | #345 | Tragic 3.07 |
| Slovaks | 0.0 /100 | #346 | Tragic 3.06 |
| Carpatho Rusyns | 0.0 /100 | #347 | Tragic 3.06 |
Demographics Similar to Salvadorans by Average Family Size
In terms of average family size, the demographic groups most similar to Salvadorans are Mexican (3.48, a difference of 0.070%), Cheyenne (3.47, a difference of 0.11%), Immigrants from El Salvador (3.49, a difference of 0.25%), Ute (3.49, a difference of 0.34%), and Yuman (3.47, a difference of 0.36%).
| Demographics | Rating | Rank | Average Family Size |
| Tohono O'odham | 100.0 /100 | #11 | Exceptional 3.53 |
| Immigrants | Mexico | 100.0 /100 | #12 | Exceptional 3.52 |
| Sioux | 100.0 /100 | #13 | Exceptional 3.52 |
| Immigrants | Central America | 100.0 /100 | #14 | Exceptional 3.49 |
| Tongans | 100.0 /100 | #15 | Exceptional 3.49 |
| Ute | 100.0 /100 | #16 | Exceptional 3.49 |
| Immigrants | El Salvador | 100.0 /100 | #17 | Exceptional 3.49 |
| Salvadorans | 100.0 /100 | #18 | Exceptional 3.48 |
| Mexicans | 100.0 /100 | #19 | Exceptional 3.48 |
| Cheyenne | 100.0 /100 | #20 | Exceptional 3.47 |
| Yuman | 100.0 /100 | #21 | Exceptional 3.47 |
| Apache | 100.0 /100 | #22 | Exceptional 3.46 |
| Immigrants | Fiji | 100.0 /100 | #23 | Exceptional 3.45 |
| Natives/Alaskans | 100.0 /100 | #24 | Exceptional 3.45 |
| Yakama | 100.0 /100 | #25 | Exceptional 3.45 |