Puget Sound Salish vs Immigrants from South America Single Mother Households
COMPARE
Puget Sound Salish
Immigrants from South America
Single Mother Households
Single Mother Households Comparison
Puget Sound Salish
Immigrants from South America
6.3%
SINGLE MOTHER HOUSEHOLDS
58.1/ 100
METRIC RATING
169th/ 347
METRIC RANK
6.7%
SINGLE MOTHER HOUSEHOLDS
11.5/ 100
METRIC RATING
207th/ 347
METRIC RANK
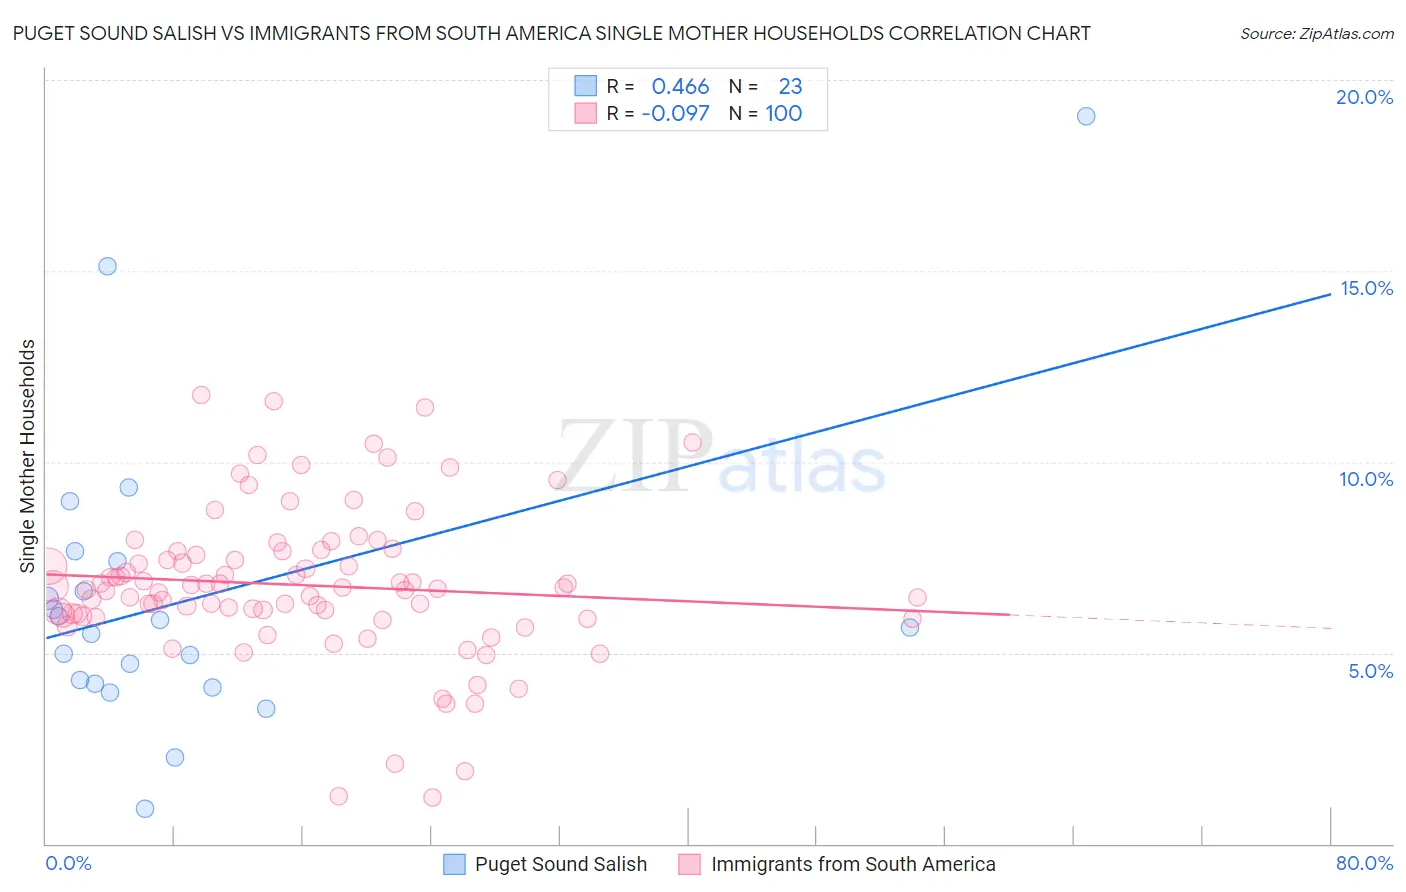
Puget Sound Salish vs Immigrants from South America Single Mother Households Correlation Chart
The statistical analysis conducted on geographies consisting of 46,127,727 people shows a moderate positive correlation between the proportion of Puget Sound Salish and percentage of single mother households in the United States with a correlation coefficient (R) of 0.466 and weighted average of 6.3%. Similarly, the statistical analysis conducted on geographies consisting of 484,293,400 people shows a slight negative correlation between the proportion of Immigrants from South America and percentage of single mother households in the United States with a correlation coefficient (R) of -0.097 and weighted average of 6.7%, a difference of 6.5%.
Single Mother Households Correlation Summary
| Measurement | Puget Sound Salish | Immigrants from South America |
| Minimum | 0.93% | 1.2% |
| Maximum | 19.0% | 11.8% |
| Range | 18.1% | 10.6% |
| Mean | 6.4% | 6.8% |
| Median | 5.7% | 6.7% |
| Interquartile 25% (IQ1) | 4.2% | 6.0% |
| Interquartile 75% (IQ3) | 7.4% | 7.6% |
| Interquartile Range (IQR) | 3.2% | 1.6% |
| Standard Deviation (Sample) | 3.9% | 2.0% |
| Standard Deviation (Population) | 3.8% | 1.9% |
Similar Demographics by Single Mother Households
Demographics Similar to Puget Sound Salish by Single Mother Households
In terms of single mother households, the demographic groups most similar to Puget Sound Salish are Immigrants from Chile (6.3%, a difference of 0.020%), Brazilian (6.2%, a difference of 0.11%), Immigrants from Oceania (6.3%, a difference of 0.40%), Afghan (6.3%, a difference of 0.63%), and Immigrants from South Eastern Asia (6.3%, a difference of 0.66%).
| Demographics | Rating | Rank | Single Mother Households |
| Immigrants | Zimbabwe | 69.9 /100 | #162 | Good 6.2% |
| Alsatians | 68.7 /100 | #163 | Good 6.2% |
| Immigrants | Northern Africa | 68.0 /100 | #164 | Good 6.2% |
| Immigrants | Syria | 67.4 /100 | #165 | Good 6.2% |
| Sri Lankans | 63.9 /100 | #166 | Good 6.2% |
| Brazilians | 59.1 /100 | #167 | Average 6.2% |
| Immigrants | Chile | 58.3 /100 | #168 | Average 6.3% |
| Puget Sound Salish | 58.1 /100 | #169 | Average 6.3% |
| Immigrants | Oceania | 54.6 /100 | #170 | Average 6.3% |
| Afghans | 52.5 /100 | #171 | Average 6.3% |
| Immigrants | South Eastern Asia | 52.2 /100 | #172 | Average 6.3% |
| Immigrants | Vietnam | 51.5 /100 | #173 | Average 6.3% |
| Immigrants | Morocco | 50.0 /100 | #174 | Average 6.3% |
| Marshallese | 45.8 /100 | #175 | Average 6.3% |
| Immigrants | Bosnia and Herzegovina | 44.3 /100 | #176 | Average 6.3% |
Demographics Similar to Immigrants from South America by Single Mother Households
In terms of single mother households, the demographic groups most similar to Immigrants from South America are German Russian (6.7%, a difference of 0.0%), Vietnamese (6.7%, a difference of 0.050%), Cree (6.7%, a difference of 0.080%), Immigrants from Fiji (6.7%, a difference of 0.10%), and Immigrants from Peru (6.7%, a difference of 0.11%).
| Demographics | Rating | Rank | Single Mother Households |
| Immigrants | Ethiopia | 14.7 /100 | #200 | Poor 6.6% |
| Venezuelans | 12.9 /100 | #201 | Poor 6.6% |
| Guamanians/Chamorros | 12.4 /100 | #202 | Poor 6.6% |
| Immigrants | Peru | 12.0 /100 | #203 | Poor 6.7% |
| Immigrants | Fiji | 11.9 /100 | #204 | Poor 6.7% |
| Cree | 11.9 /100 | #205 | Poor 6.7% |
| German Russians | 11.5 /100 | #206 | Poor 6.7% |
| Immigrants | South America | 11.5 /100 | #207 | Poor 6.7% |
| Vietnamese | 11.3 /100 | #208 | Poor 6.7% |
| Immigrants | Colombia | 10.5 /100 | #209 | Poor 6.7% |
| Immigrants | Nonimmigrants | 10.4 /100 | #210 | Poor 6.7% |
| Immigrants | Venezuela | 8.5 /100 | #211 | Tragic 6.7% |
| Immigrants | Eritrea | 8.4 /100 | #212 | Tragic 6.7% |
| Immigrants | Costa Rica | 8.2 /100 | #213 | Tragic 6.7% |
| Immigrants | Uruguay | 7.9 /100 | #214 | Tragic 6.7% |