Peruvian vs Immigrants from Western Asia Married-couple Households
COMPARE
Peruvian
Immigrants from Western Asia
Married-couple Households
Married-couple Households Comparison
Peruvians
Immigrants from Western Asia
47.6%
MARRIED-COUPLE HOUSEHOLDS
93.8/ 100
METRIC RATING
112th/ 347
METRIC RANK
46.9%
MARRIED-COUPLE HOUSEHOLDS
76.1/ 100
METRIC RATING
154th/ 347
METRIC RANK
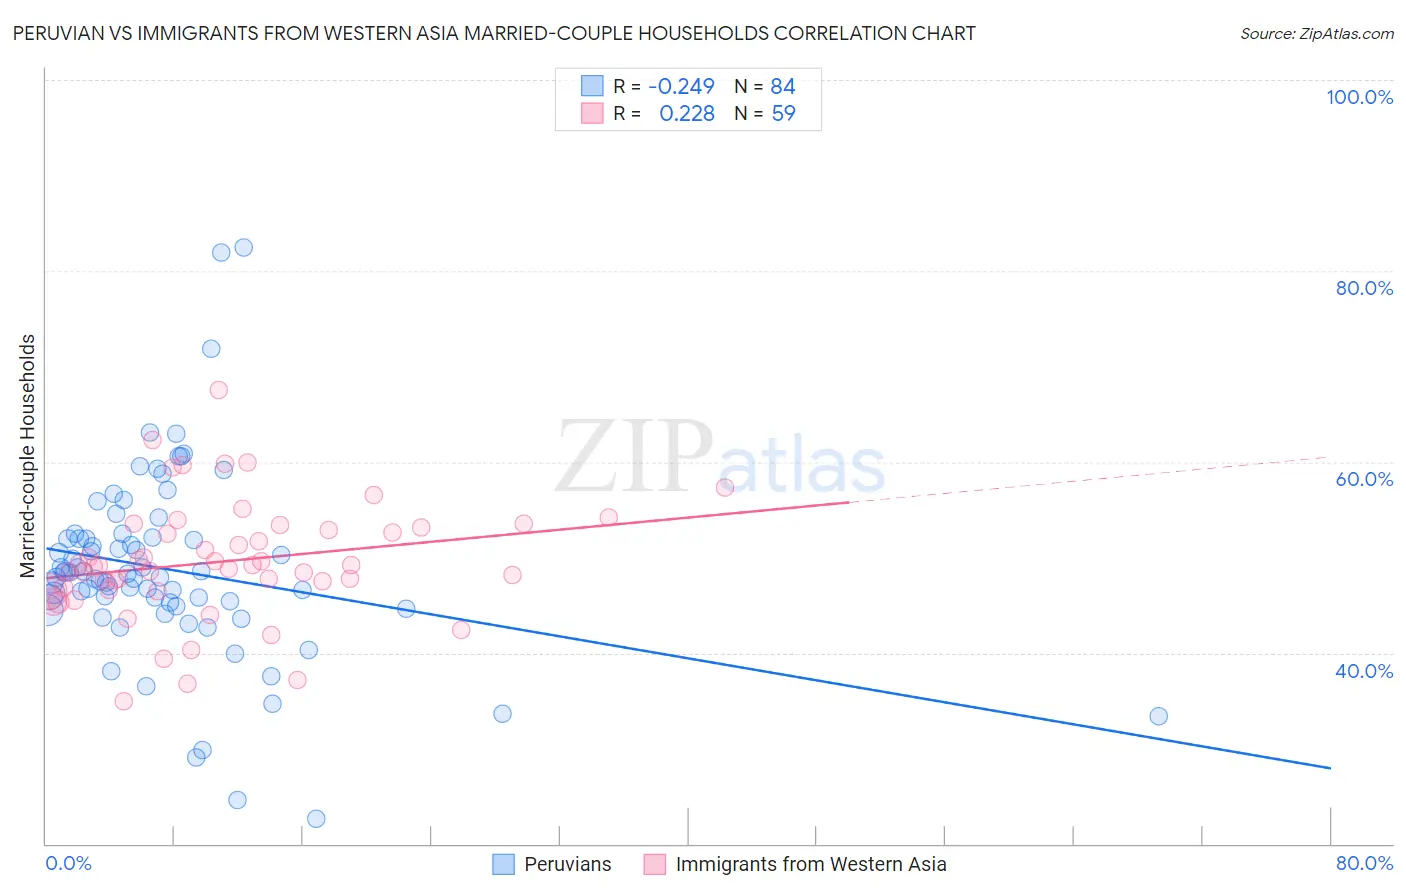
Peruvian vs Immigrants from Western Asia Married-couple Households Correlation Chart
The statistical analysis conducted on geographies consisting of 362,959,523 people shows a weak negative correlation between the proportion of Peruvians and percentage of married-couple family households in the United States with a correlation coefficient (R) of -0.249 and weighted average of 47.6%. Similarly, the statistical analysis conducted on geographies consisting of 404,157,089 people shows a weak positive correlation between the proportion of Immigrants from Western Asia and percentage of married-couple family households in the United States with a correlation coefficient (R) of 0.228 and weighted average of 46.9%, a difference of 1.5%.
Married-couple Households Correlation Summary
| Measurement | Peruvian | Immigrants from Western Asia |
| Minimum | 22.6% | 34.9% |
| Maximum | 82.5% | 67.5% |
| Range | 60.0% | 32.6% |
| Mean | 48.8% | 49.6% |
| Median | 48.1% | 49.1% |
| Interquartile 25% (IQ1) | 45.0% | 46.6% |
| Interquartile 75% (IQ3) | 52.0% | 53.1% |
| Interquartile Range (IQR) | 7.0% | 6.6% |
| Standard Deviation (Sample) | 9.8% | 6.2% |
| Standard Deviation (Population) | 9.8% | 6.1% |
Similar Demographics by Married-couple Households
Demographics Similar to Peruvians by Married-couple Households
In terms of married-couple households, the demographic groups most similar to Peruvians are Syrian (47.6%, a difference of 0.010%), Venezuelan (47.6%, a difference of 0.010%), Macedonian (47.6%, a difference of 0.020%), Immigrants from Europe (47.6%, a difference of 0.020%), and Immigrants from Jordan (47.7%, a difference of 0.040%).
| Demographics | Rating | Rank | Married-couple Households |
| Immigrants | Czechoslovakia | 95.5 /100 | #105 | Exceptional 47.8% |
| Portuguese | 95.5 /100 | #106 | Exceptional 47.8% |
| Estonians | 94.7 /100 | #107 | Exceptional 47.7% |
| Immigrants | Japan | 94.4 /100 | #108 | Exceptional 47.7% |
| Immigrants | Jordan | 94.1 /100 | #109 | Exceptional 47.7% |
| Macedonians | 93.9 /100 | #110 | Exceptional 47.6% |
| Syrians | 93.9 /100 | #111 | Exceptional 47.6% |
| Peruvians | 93.8 /100 | #112 | Exceptional 47.6% |
| Venezuelans | 93.8 /100 | #113 | Exceptional 47.6% |
| Immigrants | Europe | 93.7 /100 | #114 | Exceptional 47.6% |
| Slovaks | 92.9 /100 | #115 | Exceptional 47.6% |
| Argentineans | 92.5 /100 | #116 | Exceptional 47.5% |
| French Canadians | 92.4 /100 | #117 | Exceptional 47.5% |
| Immigrants | Germany | 92.4 /100 | #118 | Exceptional 47.5% |
| Chileans | 92.2 /100 | #119 | Exceptional 47.5% |
Demographics Similar to Immigrants from Western Asia by Married-couple Households
In terms of married-couple households, the demographic groups most similar to Immigrants from Western Asia are Hmong (47.0%, a difference of 0.0%), Serbian (47.0%, a difference of 0.010%), Arab (46.9%, a difference of 0.010%), Immigrants from Bulgaria (47.0%, a difference of 0.040%), and Armenian (46.9%, a difference of 0.040%).
| Demographics | Rating | Rank | Married-couple Households |
| Immigrants | Syria | 81.6 /100 | #147 | Excellent 47.1% |
| Icelanders | 79.5 /100 | #148 | Good 47.0% |
| Paraguayans | 78.7 /100 | #149 | Good 47.0% |
| Immigrants | Russia | 77.6 /100 | #150 | Good 47.0% |
| Immigrants | Bulgaria | 76.8 /100 | #151 | Good 47.0% |
| Serbians | 76.3 /100 | #152 | Good 47.0% |
| Hmong | 76.2 /100 | #153 | Good 47.0% |
| Immigrants | Western Asia | 76.1 /100 | #154 | Good 46.9% |
| Arabs | 76.0 /100 | #155 | Good 46.9% |
| Armenians | 75.4 /100 | #156 | Good 46.9% |
| Immigrants | Oceania | 74.8 /100 | #157 | Good 46.9% |
| Immigrants | Nonimmigrants | 73.3 /100 | #158 | Good 46.9% |
| Osage | 73.2 /100 | #159 | Good 46.9% |
| Iraqis | 71.7 /100 | #160 | Good 46.9% |
| Delaware | 71.2 /100 | #161 | Good 46.8% |