Peruvian vs Greek Single Mother Households
COMPARE
Peruvian
Greek
Single Mother Households
Single Mother Households Comparison
Peruvians
Greeks
6.5%
SINGLE MOTHER HOUSEHOLDS
21.6/ 100
METRIC RATING
190th/ 347
METRIC RANK
5.6%
SINGLE MOTHER HOUSEHOLDS
98.6/ 100
METRIC RATING
65th/ 347
METRIC RANK
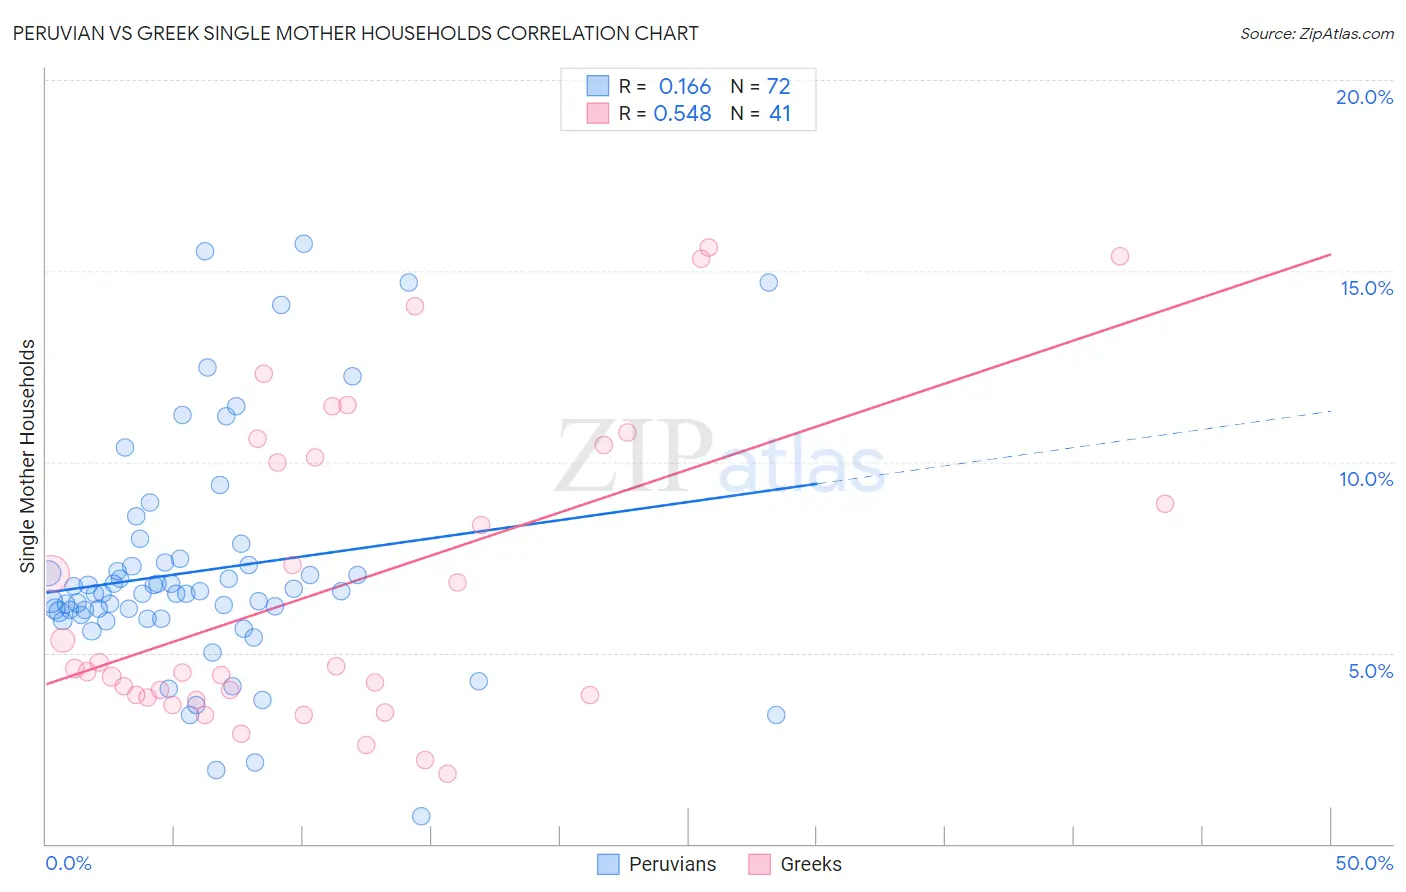
Peruvian vs Greek Single Mother Households Correlation Chart
The statistical analysis conducted on geographies consisting of 362,313,446 people shows a poor positive correlation between the proportion of Peruvians and percentage of single mother households in the United States with a correlation coefficient (R) of 0.166 and weighted average of 6.5%. Similarly, the statistical analysis conducted on geographies consisting of 480,310,145 people shows a substantial positive correlation between the proportion of Greeks and percentage of single mother households in the United States with a correlation coefficient (R) of 0.548 and weighted average of 5.6%, a difference of 17.1%.
Single Mother Households Correlation Summary
| Measurement | Peruvian | Greek |
| Minimum | 0.73% | 1.8% |
| Maximum | 15.7% | 15.6% |
| Range | 15.0% | 13.8% |
| Mean | 7.1% | 6.8% |
| Median | 6.6% | 4.6% |
| Interquartile 25% (IQ1) | 5.9% | 3.9% |
| Interquartile 75% (IQ3) | 7.3% | 10.3% |
| Interquartile Range (IQR) | 1.4% | 6.4% |
| Standard Deviation (Sample) | 3.0% | 4.0% |
| Standard Deviation (Population) | 3.0% | 4.0% |
Similar Demographics by Single Mother Households
Demographics Similar to Peruvians by Single Mother Households
In terms of single mother households, the demographic groups most similar to Peruvians are Samoan (6.5%, a difference of 0.060%), Delaware (6.5%, a difference of 0.26%), Ottawa (6.5%, a difference of 0.33%), American (6.6%, a difference of 0.43%), and Immigrants from Afghanistan (6.5%, a difference of 0.46%).
| Demographics | Rating | Rank | Single Mother Households |
| Spaniards | 27.8 /100 | #183 | Fair 6.5% |
| Ethiopians | 26.0 /100 | #184 | Fair 6.5% |
| Ugandans | 25.6 /100 | #185 | Fair 6.5% |
| Costa Ricans | 24.8 /100 | #186 | Fair 6.5% |
| Immigrants | Afghanistan | 24.7 /100 | #187 | Fair 6.5% |
| Ottawa | 23.8 /100 | #188 | Fair 6.5% |
| Delaware | 23.3 /100 | #189 | Fair 6.5% |
| Peruvians | 21.6 /100 | #190 | Fair 6.5% |
| Samoans | 21.2 /100 | #191 | Fair 6.5% |
| Americans | 19.0 /100 | #192 | Poor 6.6% |
| Colombians | 18.3 /100 | #193 | Poor 6.6% |
| Immigrants | Uganda | 18.3 /100 | #194 | Poor 6.6% |
| South Americans | 18.0 /100 | #195 | Poor 6.6% |
| Uruguayans | 18.0 /100 | #196 | Poor 6.6% |
| Moroccans | 17.4 /100 | #197 | Poor 6.6% |
Demographics Similar to Greeks by Single Mother Households
In terms of single mother households, the demographic groups most similar to Greeks are Immigrants from France (5.6%, a difference of 0.040%), Immigrants from North Macedonia (5.6%, a difference of 0.080%), Immigrants from Canada (5.6%, a difference of 0.10%), Italian (5.6%, a difference of 0.12%), and Polish (5.6%, a difference of 0.15%).
| Demographics | Rating | Rank | Single Mother Households |
| Danes | 98.9 /100 | #58 | Exceptional 5.5% |
| Luxembourgers | 98.7 /100 | #59 | Exceptional 5.6% |
| Immigrants | Norway | 98.7 /100 | #60 | Exceptional 5.6% |
| Australians | 98.7 /100 | #61 | Exceptional 5.6% |
| Poles | 98.6 /100 | #62 | Exceptional 5.6% |
| Immigrants | North Macedonia | 98.6 /100 | #63 | Exceptional 5.6% |
| Immigrants | France | 98.6 /100 | #64 | Exceptional 5.6% |
| Greeks | 98.6 /100 | #65 | Exceptional 5.6% |
| Immigrants | Canada | 98.5 /100 | #66 | Exceptional 5.6% |
| Italians | 98.5 /100 | #67 | Exceptional 5.6% |
| Immigrants | Bulgaria | 98.5 /100 | #68 | Exceptional 5.6% |
| Asians | 98.5 /100 | #69 | Exceptional 5.6% |
| Immigrants | Eastern Europe | 98.4 /100 | #70 | Exceptional 5.6% |
| Immigrants | Kazakhstan | 98.4 /100 | #71 | Exceptional 5.6% |
| Immigrants | Netherlands | 98.4 /100 | #72 | Exceptional 5.6% |