Peruvian vs Carpatho Rusyn Single Mother Households
COMPARE
Peruvian
Carpatho Rusyn
Single Mother Households
Single Mother Households Comparison
Peruvians
Carpatho Rusyns
6.5%
SINGLE MOTHER HOUSEHOLDS
21.6/ 100
METRIC RATING
190th/ 347
METRIC RANK
5.7%
SINGLE MOTHER HOUSEHOLDS
97.7/ 100
METRIC RATING
84th/ 347
METRIC RANK
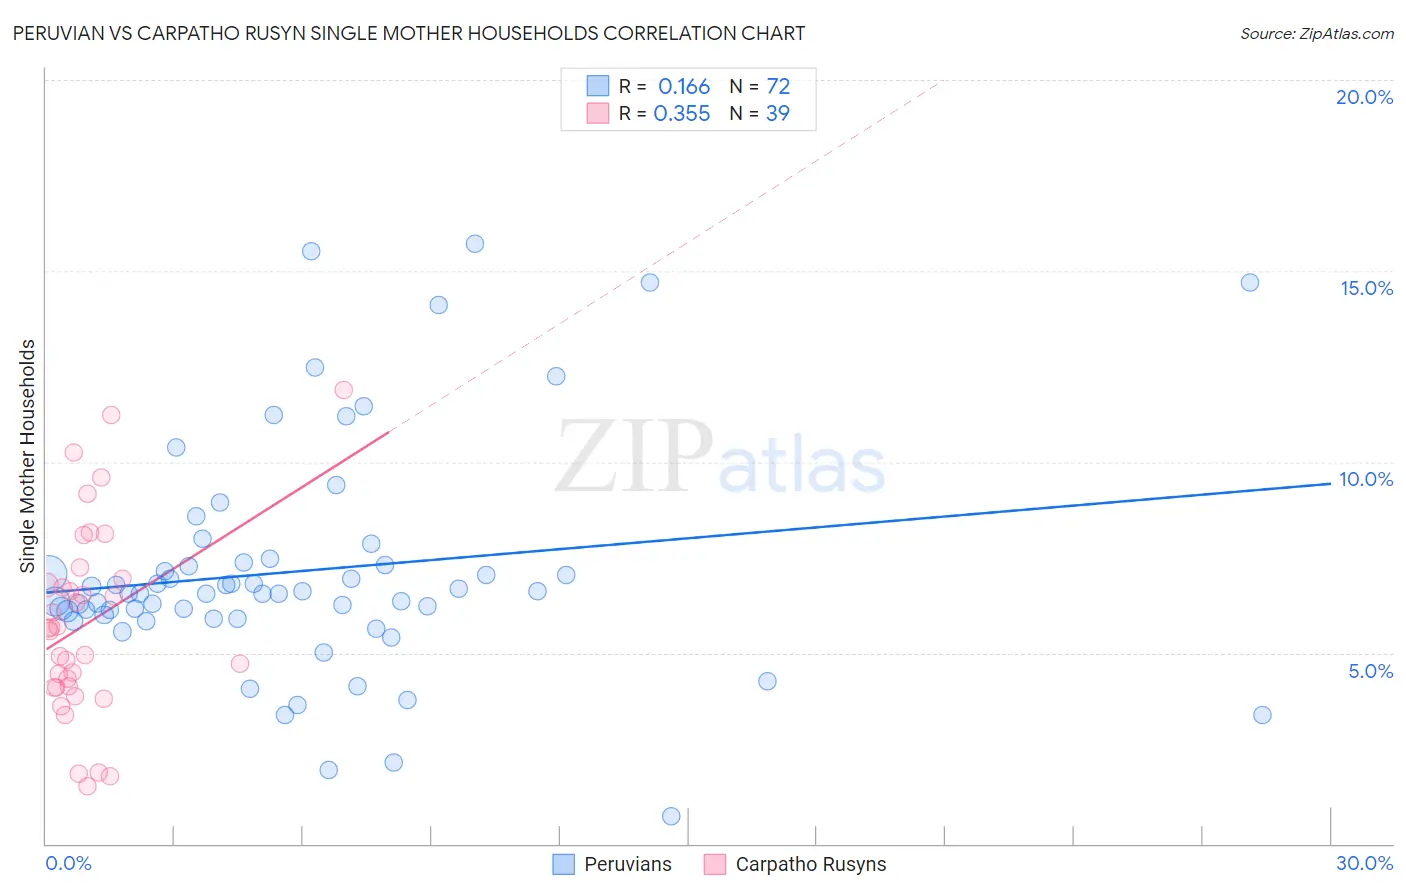
Peruvian vs Carpatho Rusyn Single Mother Households Correlation Chart
The statistical analysis conducted on geographies consisting of 362,313,446 people shows a poor positive correlation between the proportion of Peruvians and percentage of single mother households in the United States with a correlation coefficient (R) of 0.166 and weighted average of 6.5%. Similarly, the statistical analysis conducted on geographies consisting of 58,858,752 people shows a mild positive correlation between the proportion of Carpatho Rusyns and percentage of single mother households in the United States with a correlation coefficient (R) of 0.355 and weighted average of 5.7%, a difference of 15.3%.
Single Mother Households Correlation Summary
| Measurement | Peruvian | Carpatho Rusyn |
| Minimum | 0.73% | 1.5% |
| Maximum | 15.7% | 11.9% |
| Range | 15.0% | 10.4% |
| Mean | 7.1% | 5.8% |
| Median | 6.6% | 5.6% |
| Interquartile 25% (IQ1) | 5.9% | 4.1% |
| Interquartile 75% (IQ3) | 7.3% | 6.9% |
| Interquartile Range (IQR) | 1.4% | 2.8% |
| Standard Deviation (Sample) | 3.0% | 2.5% |
| Standard Deviation (Population) | 3.0% | 2.5% |
Similar Demographics by Single Mother Households
Demographics Similar to Peruvians by Single Mother Households
In terms of single mother households, the demographic groups most similar to Peruvians are Samoan (6.5%, a difference of 0.060%), Delaware (6.5%, a difference of 0.26%), Ottawa (6.5%, a difference of 0.33%), American (6.6%, a difference of 0.43%), and Immigrants from Afghanistan (6.5%, a difference of 0.46%).
| Demographics | Rating | Rank | Single Mother Households |
| Spaniards | 27.8 /100 | #183 | Fair 6.5% |
| Ethiopians | 26.0 /100 | #184 | Fair 6.5% |
| Ugandans | 25.6 /100 | #185 | Fair 6.5% |
| Costa Ricans | 24.8 /100 | #186 | Fair 6.5% |
| Immigrants | Afghanistan | 24.7 /100 | #187 | Fair 6.5% |
| Ottawa | 23.8 /100 | #188 | Fair 6.5% |
| Delaware | 23.3 /100 | #189 | Fair 6.5% |
| Peruvians | 21.6 /100 | #190 | Fair 6.5% |
| Samoans | 21.2 /100 | #191 | Fair 6.5% |
| Americans | 19.0 /100 | #192 | Poor 6.6% |
| Colombians | 18.3 /100 | #193 | Poor 6.6% |
| Immigrants | Uganda | 18.3 /100 | #194 | Poor 6.6% |
| South Americans | 18.0 /100 | #195 | Poor 6.6% |
| Uruguayans | 18.0 /100 | #196 | Poor 6.6% |
| Moroccans | 17.4 /100 | #197 | Poor 6.6% |
Demographics Similar to Carpatho Rusyns by Single Mother Households
In terms of single mother households, the demographic groups most similar to Carpatho Rusyns are Immigrants from Hungary (5.7%, a difference of 0.080%), Immigrants from Malaysia (5.7%, a difference of 0.10%), Hungarian (5.7%, a difference of 0.15%), Finnish (5.7%, a difference of 0.18%), and Immigrants from Turkey (5.7%, a difference of 0.26%).
| Demographics | Rating | Rank | Single Mother Households |
| Romanians | 98.1 /100 | #77 | Exceptional 5.6% |
| Swiss | 98.1 /100 | #78 | Exceptional 5.6% |
| Immigrants | Sri Lanka | 98.0 /100 | #79 | Exceptional 5.6% |
| Czechs | 97.9 /100 | #80 | Exceptional 5.6% |
| Immigrants | Moldova | 97.9 /100 | #81 | Exceptional 5.6% |
| Immigrants | Malaysia | 97.8 /100 | #82 | Exceptional 5.7% |
| Immigrants | Hungary | 97.8 /100 | #83 | Exceptional 5.7% |
| Carpatho Rusyns | 97.7 /100 | #84 | Exceptional 5.7% |
| Hungarians | 97.6 /100 | #85 | Exceptional 5.7% |
| Finns | 97.6 /100 | #86 | Exceptional 5.7% |
| Immigrants | Turkey | 97.5 /100 | #87 | Exceptional 5.7% |
| Israelis | 97.4 /100 | #88 | Exceptional 5.7% |
| Ukrainians | 97.2 /100 | #89 | Exceptional 5.7% |
| Immigrants | Indonesia | 97.2 /100 | #90 | Exceptional 5.7% |
| Europeans | 97.0 /100 | #91 | Exceptional 5.7% |