Peruvian vs Immigrants from Panama Single Mother Households
COMPARE
Peruvian
Immigrants from Panama
Single Mother Households
Single Mother Households Comparison
Peruvians
Immigrants from Panama
6.5%
SINGLE MOTHER HOUSEHOLDS
21.6/ 100
METRIC RATING
190th/ 347
METRIC RANK
7.2%
SINGLE MOTHER HOUSEHOLDS
0.7/ 100
METRIC RATING
240th/ 347
METRIC RANK
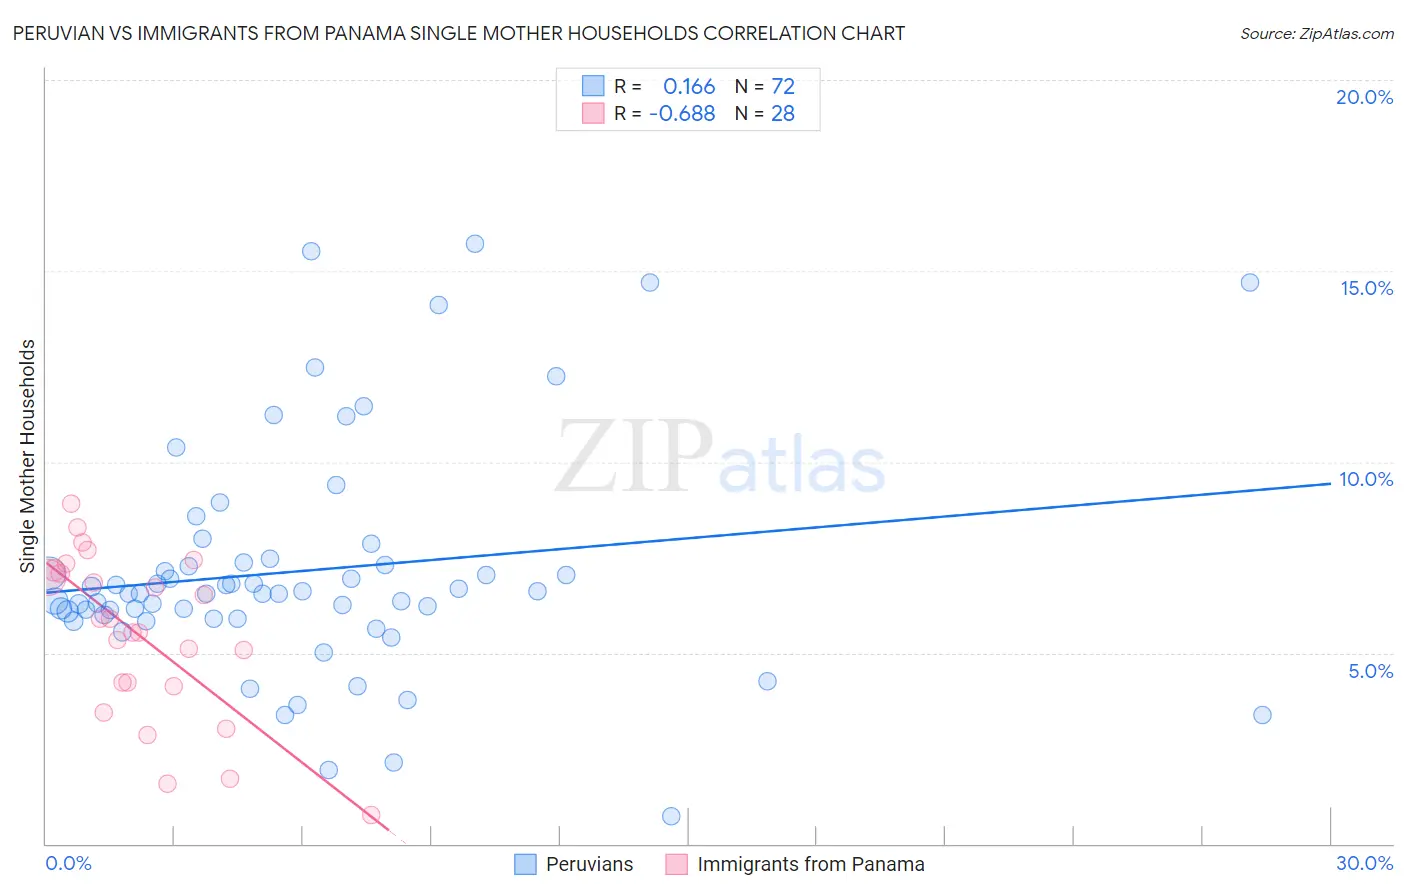
Peruvian vs Immigrants from Panama Single Mother Households Correlation Chart
The statistical analysis conducted on geographies consisting of 362,313,446 people shows a poor positive correlation between the proportion of Peruvians and percentage of single mother households in the United States with a correlation coefficient (R) of 0.166 and weighted average of 6.5%. Similarly, the statistical analysis conducted on geographies consisting of 221,053,842 people shows a significant negative correlation between the proportion of Immigrants from Panama and percentage of single mother households in the United States with a correlation coefficient (R) of -0.688 and weighted average of 7.2%, a difference of 9.6%.
Single Mother Households Correlation Summary
| Measurement | Peruvian | Immigrants from Panama |
| Minimum | 0.73% | 0.75% |
| Maximum | 15.7% | 8.9% |
| Range | 15.0% | 8.2% |
| Mean | 7.1% | 5.5% |
| Median | 6.6% | 5.7% |
| Interquartile 25% (IQ1) | 5.9% | 4.2% |
| Interquartile 75% (IQ3) | 7.3% | 7.1% |
| Interquartile Range (IQR) | 1.4% | 3.0% |
| Standard Deviation (Sample) | 3.0% | 2.1% |
| Standard Deviation (Population) | 3.0% | 2.1% |
Similar Demographics by Single Mother Households
Demographics Similar to Peruvians by Single Mother Households
In terms of single mother households, the demographic groups most similar to Peruvians are Samoan (6.5%, a difference of 0.060%), Delaware (6.5%, a difference of 0.26%), Ottawa (6.5%, a difference of 0.33%), American (6.6%, a difference of 0.43%), and Immigrants from Afghanistan (6.5%, a difference of 0.46%).
| Demographics | Rating | Rank | Single Mother Households |
| Spaniards | 27.8 /100 | #183 | Fair 6.5% |
| Ethiopians | 26.0 /100 | #184 | Fair 6.5% |
| Ugandans | 25.6 /100 | #185 | Fair 6.5% |
| Costa Ricans | 24.8 /100 | #186 | Fair 6.5% |
| Immigrants | Afghanistan | 24.7 /100 | #187 | Fair 6.5% |
| Ottawa | 23.8 /100 | #188 | Fair 6.5% |
| Delaware | 23.3 /100 | #189 | Fair 6.5% |
| Peruvians | 21.6 /100 | #190 | Fair 6.5% |
| Samoans | 21.2 /100 | #191 | Fair 6.5% |
| Americans | 19.0 /100 | #192 | Poor 6.6% |
| Colombians | 18.3 /100 | #193 | Poor 6.6% |
| Immigrants | Uganda | 18.3 /100 | #194 | Poor 6.6% |
| South Americans | 18.0 /100 | #195 | Poor 6.6% |
| Uruguayans | 18.0 /100 | #196 | Poor 6.6% |
| Moroccans | 17.4 /100 | #197 | Poor 6.6% |
Demographics Similar to Immigrants from Panama by Single Mother Households
In terms of single mother households, the demographic groups most similar to Immigrants from Panama are Kiowa (7.1%, a difference of 0.32%), Immigrants from Portugal (7.2%, a difference of 0.35%), Fijian (7.2%, a difference of 0.43%), Ecuadorian (7.2%, a difference of 0.48%), and Cuban (7.2%, a difference of 0.54%).
| Demographics | Rating | Rank | Single Mother Households |
| Choctaw | 1.4 /100 | #233 | Tragic 7.0% |
| Chickasaw | 1.4 /100 | #234 | Tragic 7.0% |
| Immigrants | Burma/Myanmar | 1.4 /100 | #235 | Tragic 7.0% |
| Ute | 1.0 /100 | #236 | Tragic 7.1% |
| Arapaho | 1.0 /100 | #237 | Tragic 7.1% |
| Panamanians | 0.9 /100 | #238 | Tragic 7.1% |
| Kiowa | 0.8 /100 | #239 | Tragic 7.1% |
| Immigrants | Panama | 0.7 /100 | #240 | Tragic 7.2% |
| Immigrants | Portugal | 0.6 /100 | #241 | Tragic 7.2% |
| Fijians | 0.6 /100 | #242 | Tragic 7.2% |
| Ecuadorians | 0.6 /100 | #243 | Tragic 7.2% |
| Cubans | 0.6 /100 | #244 | Tragic 7.2% |
| Immigrants | Cambodia | 0.5 /100 | #245 | Tragic 7.2% |
| Nicaraguans | 0.5 /100 | #246 | Tragic 7.2% |
| Dutch West Indians | 0.4 /100 | #247 | Tragic 7.3% |