Paraguayan vs Immigrants from Sri Lanka Average Family Size
COMPARE
Paraguayan
Immigrants from Sri Lanka
Average Family Size
Average Family Size Comparison
Paraguayans
Immigrants from Sri Lanka
3.20
AVERAGE FAMILY SIZE
16.3/ 100
METRIC RATING
205th/ 347
METRIC RANK
3.22
AVERAGE FAMILY SIZE
39.8/ 100
METRIC RATING
185th/ 347
METRIC RANK
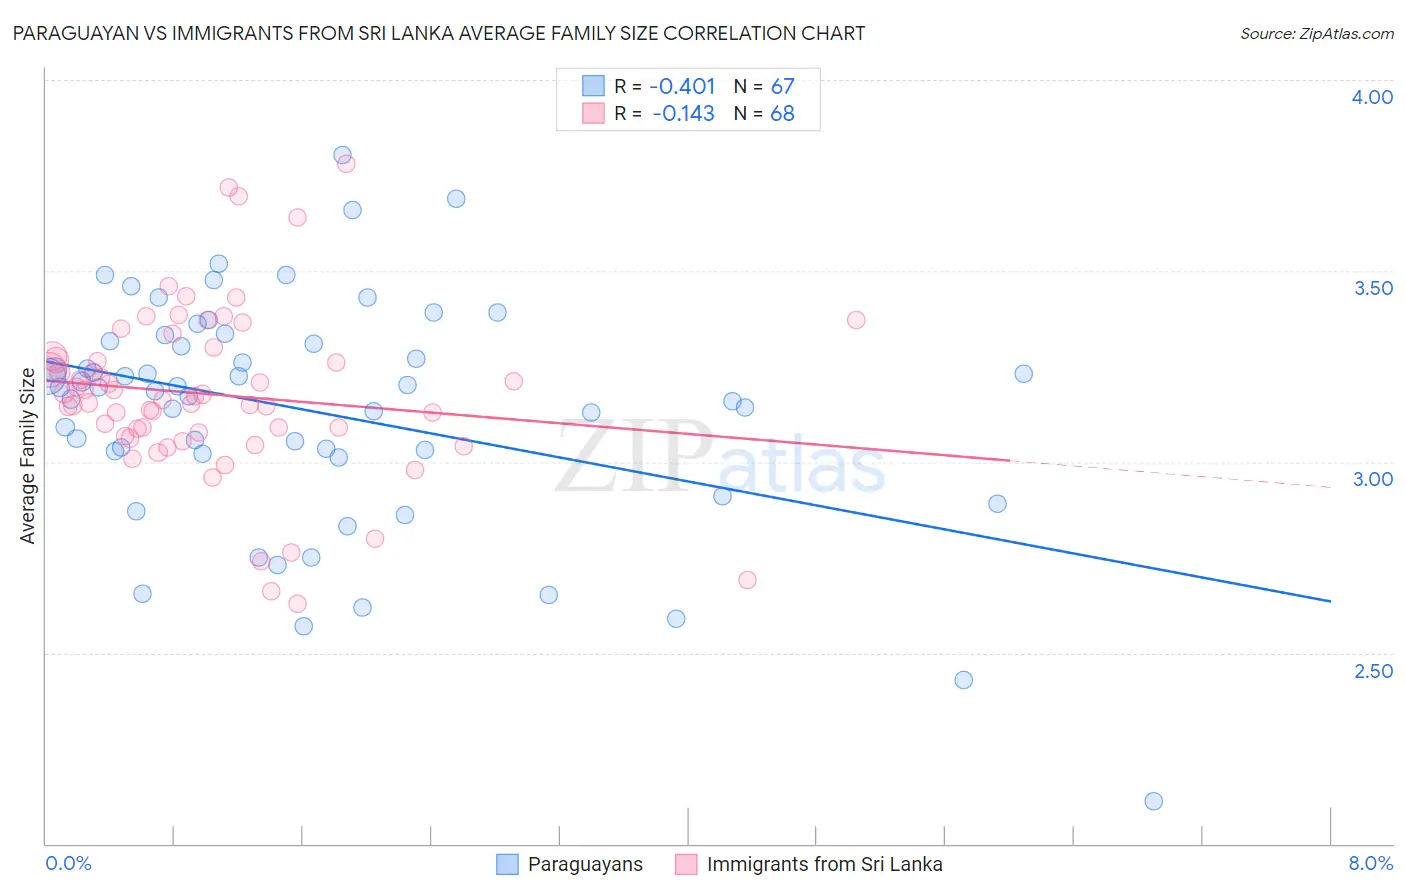
Paraguayan vs Immigrants from Sri Lanka Average Family Size Correlation Chart
The statistical analysis conducted on geographies consisting of 95,095,397 people shows a moderate negative correlation between the proportion of Paraguayans and average family size in the United States with a correlation coefficient (R) of -0.401 and weighted average of 3.20. Similarly, the statistical analysis conducted on geographies consisting of 149,689,020 people shows a poor negative correlation between the proportion of Immigrants from Sri Lanka and average family size in the United States with a correlation coefficient (R) of -0.143 and weighted average of 3.22, a difference of 0.56%.
Average Family Size Correlation Summary
| Measurement | Paraguayan | Immigrants from Sri Lanka |
| Minimum | 2.11 | 2.63 |
| Maximum | 3.80 | 3.78 |
| Range | 1.69 | 1.15 |
| Mean | 3.13 | 3.18 |
| Median | 3.19 | 3.17 |
| Interquartile 25% (IQ1) | 3.02 | 3.07 |
| Interquartile 75% (IQ3) | 3.32 | 3.27 |
| Interquartile Range (IQR) | 0.29 | 0.20 |
| Standard Deviation (Sample) | 0.31 | 0.22 |
| Standard Deviation (Population) | 0.30 | 0.22 |
Demographics Similar to Paraguayans and Immigrants from Sri Lanka by Average Family Size
In terms of average family size, the demographic groups most similar to Paraguayans are Immigrants from Poland (3.20, a difference of 0.010%), Immigrants from Nepal (3.21, a difference of 0.060%), Immigrants from Morocco (3.21, a difference of 0.070%), Immigrants from India (3.21, a difference of 0.070%), and Immigrants from Kenya (3.21, a difference of 0.090%). Similarly, the demographic groups most similar to Immigrants from Sri Lanka are Immigrants from Argentina (3.22, a difference of 0.0%), Immigrants from Malaysia (3.22, a difference of 0.020%), Thai (3.22, a difference of 0.030%), Pakistani (3.22, a difference of 0.12%), and Burmese (3.22, a difference of 0.18%).
| Demographics | Rating | Rank | Average Family Size |
| Immigrants | Sri Lanka | 39.8 /100 | #185 | Fair 3.22 |
| Immigrants | Argentina | 39.8 /100 | #186 | Fair 3.22 |
| Immigrants | Malaysia | 39.0 /100 | #187 | Fair 3.22 |
| Thais | 38.3 /100 | #188 | Fair 3.22 |
| Pakistanis | 33.7 /100 | #189 | Fair 3.22 |
| Burmese | 31.0 /100 | #190 | Fair 3.22 |
| Immigrants | Zaire | 30.5 /100 | #191 | Fair 3.22 |
| Immigrants | Eastern Africa | 30.1 /100 | #192 | Fair 3.22 |
| Immigrants | Israel | 29.3 /100 | #193 | Fair 3.22 |
| Immigrants | Sudan | 29.1 /100 | #194 | Fair 3.22 |
| Choctaw | 28.3 /100 | #195 | Fair 3.21 |
| Senegalese | 28.2 /100 | #196 | Fair 3.21 |
| Kenyans | 28.0 /100 | #197 | Fair 3.21 |
| Immigrants | Azores | 21.7 /100 | #198 | Fair 3.21 |
| Hmong | 20.7 /100 | #199 | Fair 3.21 |
| Immigrants | Kenya | 19.2 /100 | #200 | Poor 3.21 |
| Immigrants | Morocco | 18.5 /100 | #201 | Poor 3.21 |
| Immigrants | India | 18.5 /100 | #202 | Poor 3.21 |
| Immigrants | Nepal | 18.1 /100 | #203 | Poor 3.21 |
| Immigrants | Poland | 16.6 /100 | #204 | Poor 3.20 |
| Paraguayans | 16.3 /100 | #205 | Poor 3.20 |