Panamanian vs Delaware Currently Married
COMPARE
Panamanian
Delaware
Currently Married
Currently Married Comparison
Panamanians
Delaware
45.3%
CURRENTLY MARRIED
4.0/ 100
METRIC RATING
218th/ 347
METRIC RANK
46.9%
CURRENTLY MARRIED
64.7/ 100
METRIC RATING
163rd/ 347
METRIC RANK
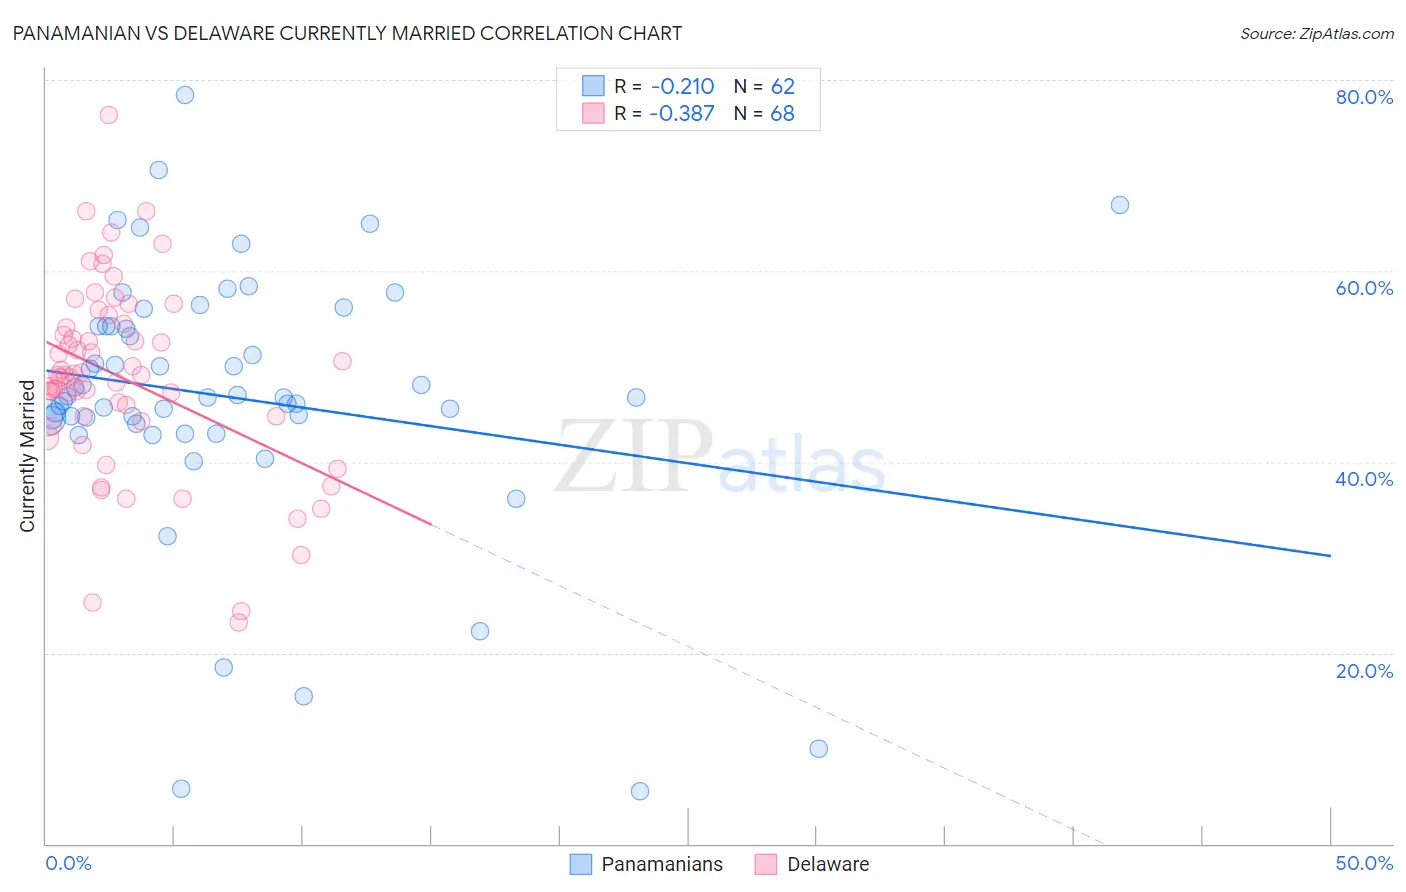
Panamanian vs Delaware Currently Married Correlation Chart
The statistical analysis conducted on geographies consisting of 281,208,339 people shows a weak negative correlation between the proportion of Panamanians and percentage of population currently married in the United States with a correlation coefficient (R) of -0.210 and weighted average of 45.3%. Similarly, the statistical analysis conducted on geographies consisting of 96,237,198 people shows a mild negative correlation between the proportion of Delaware and percentage of population currently married in the United States with a correlation coefficient (R) of -0.387 and weighted average of 46.9%, a difference of 3.6%.
Currently Married Correlation Summary
| Measurement | Panamanian | Delaware |
| Minimum | 5.5% | 23.2% |
| Maximum | 78.4% | 76.3% |
| Range | 72.9% | 53.1% |
| Mean | 46.8% | 48.7% |
| Median | 46.8% | 49.1% |
| Interquartile 25% (IQ1) | 44.6% | 44.5% |
| Interquartile 75% (IQ3) | 54.2% | 54.2% |
| Interquartile Range (IQR) | 9.5% | 9.7% |
| Standard Deviation (Sample) | 14.0% | 9.9% |
| Standard Deviation (Population) | 13.9% | 9.9% |
Similar Demographics by Currently Married
Demographics Similar to Panamanians by Currently Married
In terms of currently married, the demographic groups most similar to Panamanians are Immigrants from Portugal (45.2%, a difference of 0.12%), Immigrants from Thailand (45.4%, a difference of 0.24%), Kenyan (45.2%, a difference of 0.24%), Mexican (45.2%, a difference of 0.26%), and Immigrants from Morocco (45.4%, a difference of 0.33%).
| Demographics | Rating | Rank | Currently Married |
| Houma | 7.2 /100 | #211 | Tragic 45.5% |
| Marshallese | 7.2 /100 | #212 | Tragic 45.5% |
| Alaska Natives | 7.0 /100 | #213 | Tragic 45.5% |
| Dutch West Indians | 6.7 /100 | #214 | Tragic 45.5% |
| German Russians | 6.7 /100 | #215 | Tragic 45.5% |
| Immigrants | Morocco | 5.5 /100 | #216 | Tragic 45.4% |
| Immigrants | Thailand | 5.1 /100 | #217 | Tragic 45.4% |
| Panamanians | 4.0 /100 | #218 | Tragic 45.3% |
| Immigrants | Portugal | 3.5 /100 | #219 | Tragic 45.2% |
| Kenyans | 3.1 /100 | #220 | Tragic 45.2% |
| Mexicans | 3.0 /100 | #221 | Tragic 45.2% |
| Immigrants | Azores | 2.5 /100 | #222 | Tragic 45.1% |
| Immigrants | Laos | 2.3 /100 | #223 | Tragic 45.0% |
| Immigrants | Uganda | 2.2 /100 | #224 | Tragic 45.0% |
| French American Indians | 2.2 /100 | #225 | Tragic 45.0% |
Demographics Similar to Delaware by Currently Married
In terms of currently married, the demographic groups most similar to Delaware are Immigrants from Western Asia (46.9%, a difference of 0.020%), Nonimmigrants (46.9%, a difference of 0.030%), Immigrants from Uzbekistan (46.9%, a difference of 0.050%), Immigrants from Southern Europe (46.9%, a difference of 0.050%), and Iraqi (46.9%, a difference of 0.070%).
| Demographics | Rating | Rank | Currently Married |
| Spanish | 68.1 /100 | #156 | Good 47.0% |
| Immigrants | Switzerland | 67.8 /100 | #157 | Good 46.9% |
| Cherokee | 66.8 /100 | #158 | Good 46.9% |
| Iraqis | 66.4 /100 | #159 | Good 46.9% |
| Immigrants | Uzbekistan | 66.0 /100 | #160 | Good 46.9% |
| Immigrants | Southern Europe | 65.9 /100 | #161 | Good 46.9% |
| Immigrants | Nonimmigrants | 65.4 /100 | #162 | Good 46.9% |
| Delaware | 64.7 /100 | #163 | Good 46.9% |
| Immigrants | Western Asia | 64.2 /100 | #164 | Good 46.9% |
| Samoans | 59.8 /100 | #165 | Average 46.8% |
| Immigrants | Syria | 59.3 /100 | #166 | Average 46.8% |
| Spaniards | 58.8 /100 | #167 | Average 46.8% |
| Immigrants | Afghanistan | 58.2 /100 | #168 | Average 46.8% |
| Armenians | 58.2 /100 | #169 | Average 46.8% |
| Immigrants | Latvia | 56.7 /100 | #170 | Average 46.7% |