Panamanian vs Immigrants from Chile Currently Married
COMPARE
Panamanian
Immigrants from Chile
Currently Married
Currently Married Comparison
Panamanians
Immigrants from Chile
45.3%
CURRENTLY MARRIED
4.0/ 100
METRIC RATING
218th/ 347
METRIC RANK
46.4%
CURRENTLY MARRIED
36.8/ 100
METRIC RATING
186th/ 347
METRIC RANK
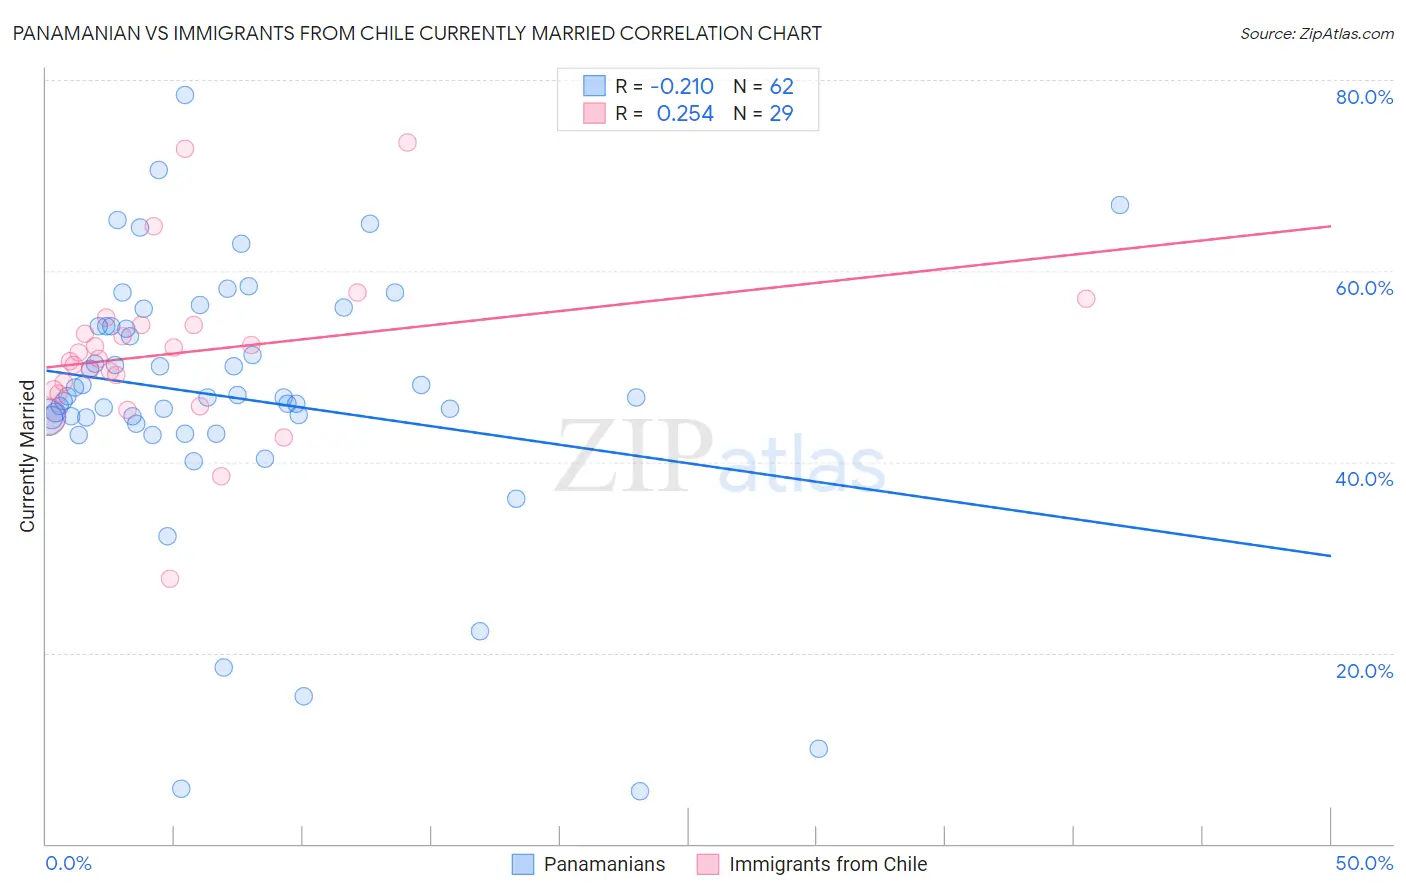
Panamanian vs Immigrants from Chile Currently Married Correlation Chart
The statistical analysis conducted on geographies consisting of 281,208,339 people shows a weak negative correlation between the proportion of Panamanians and percentage of population currently married in the United States with a correlation coefficient (R) of -0.210 and weighted average of 45.3%. Similarly, the statistical analysis conducted on geographies consisting of 218,644,057 people shows a weak positive correlation between the proportion of Immigrants from Chile and percentage of population currently married in the United States with a correlation coefficient (R) of 0.254 and weighted average of 46.4%, a difference of 2.5%.
Currently Married Correlation Summary
| Measurement | Panamanian | Immigrants from Chile |
| Minimum | 5.5% | 27.8% |
| Maximum | 78.4% | 73.4% |
| Range | 72.9% | 45.6% |
| Mean | 46.8% | 51.4% |
| Median | 46.8% | 50.8% |
| Interquartile 25% (IQ1) | 44.6% | 47.3% |
| Interquartile 75% (IQ3) | 54.2% | 54.4% |
| Interquartile Range (IQR) | 9.5% | 7.0% |
| Standard Deviation (Sample) | 14.0% | 8.9% |
| Standard Deviation (Population) | 13.9% | 8.7% |
Similar Demographics by Currently Married
Demographics Similar to Panamanians by Currently Married
In terms of currently married, the demographic groups most similar to Panamanians are Immigrants from Portugal (45.2%, a difference of 0.12%), Immigrants from Thailand (45.4%, a difference of 0.24%), Kenyan (45.2%, a difference of 0.24%), Mexican (45.2%, a difference of 0.26%), and Immigrants from Morocco (45.4%, a difference of 0.33%).
| Demographics | Rating | Rank | Currently Married |
| Houma | 7.2 /100 | #211 | Tragic 45.5% |
| Marshallese | 7.2 /100 | #212 | Tragic 45.5% |
| Alaska Natives | 7.0 /100 | #213 | Tragic 45.5% |
| Dutch West Indians | 6.7 /100 | #214 | Tragic 45.5% |
| German Russians | 6.7 /100 | #215 | Tragic 45.5% |
| Immigrants | Morocco | 5.5 /100 | #216 | Tragic 45.4% |
| Immigrants | Thailand | 5.1 /100 | #217 | Tragic 45.4% |
| Panamanians | 4.0 /100 | #218 | Tragic 45.3% |
| Immigrants | Portugal | 3.5 /100 | #219 | Tragic 45.2% |
| Kenyans | 3.1 /100 | #220 | Tragic 45.2% |
| Mexicans | 3.0 /100 | #221 | Tragic 45.2% |
| Immigrants | Azores | 2.5 /100 | #222 | Tragic 45.1% |
| Immigrants | Laos | 2.3 /100 | #223 | Tragic 45.0% |
| Immigrants | Uganda | 2.2 /100 | #224 | Tragic 45.0% |
| French American Indians | 2.2 /100 | #225 | Tragic 45.0% |
Demographics Similar to Immigrants from Chile by Currently Married
In terms of currently married, the demographic groups most similar to Immigrants from Chile are Mongolian (46.4%, a difference of 0.030%), Immigrants from Peru (46.4%, a difference of 0.060%), Brazilian (46.4%, a difference of 0.10%), Immigrants from Northern Africa (46.5%, a difference of 0.11%), and Potawatomi (46.5%, a difference of 0.20%).
| Demographics | Rating | Rank | Currently Married |
| Immigrants | Oceania | 44.6 /100 | #179 | Average 46.5% |
| Costa Ricans | 43.7 /100 | #180 | Average 46.5% |
| Ottawa | 43.0 /100 | #181 | Average 46.5% |
| Potawatomi | 41.9 /100 | #182 | Average 46.5% |
| Immigrants | Northern Africa | 39.7 /100 | #183 | Fair 46.5% |
| Brazilians | 39.3 /100 | #184 | Fair 46.4% |
| Mongolians | 37.6 /100 | #185 | Fair 46.4% |
| Immigrants | Chile | 36.8 /100 | #186 | Fair 46.4% |
| Immigrants | Peru | 35.3 /100 | #187 | Fair 46.4% |
| Colombians | 31.8 /100 | #188 | Fair 46.3% |
| Fijians | 30.3 /100 | #189 | Fair 46.3% |
| Choctaw | 29.1 /100 | #190 | Fair 46.3% |
| Immigrants | France | 27.7 /100 | #191 | Fair 46.2% |
| Soviet Union | 25.7 /100 | #192 | Fair 46.2% |
| Immigrants | Fiji | 25.0 /100 | #193 | Fair 46.2% |