Panamanian vs Norwegian Currently Married
COMPARE
Panamanian
Norwegian
Currently Married
Currently Married Comparison
Panamanians
Norwegians
45.3%
CURRENTLY MARRIED
4.0/ 100
METRIC RATING
218th/ 347
METRIC RANK
50.2%
CURRENTLY MARRIED
100.0/ 100
METRIC RATING
6th/ 347
METRIC RANK
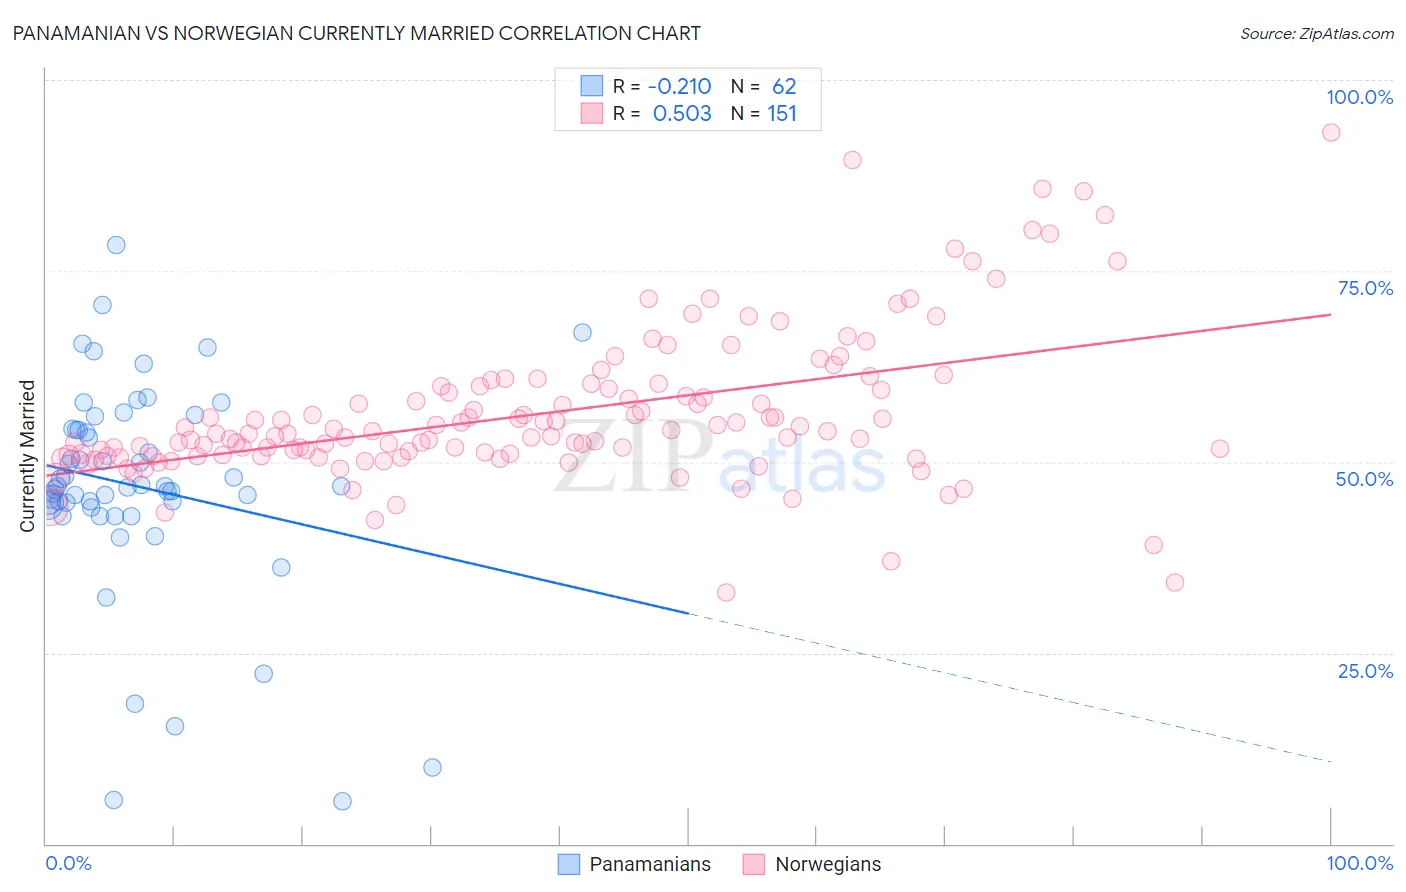
Panamanian vs Norwegian Currently Married Correlation Chart
The statistical analysis conducted on geographies consisting of 281,208,339 people shows a weak negative correlation between the proportion of Panamanians and percentage of population currently married in the United States with a correlation coefficient (R) of -0.210 and weighted average of 45.3%. Similarly, the statistical analysis conducted on geographies consisting of 533,299,404 people shows a substantial positive correlation between the proportion of Norwegians and percentage of population currently married in the United States with a correlation coefficient (R) of 0.503 and weighted average of 50.2%, a difference of 10.8%.
Currently Married Correlation Summary
| Measurement | Panamanian | Norwegian |
| Minimum | 5.5% | 32.9% |
| Maximum | 78.4% | 93.0% |
| Range | 72.9% | 60.2% |
| Mean | 46.8% | 56.4% |
| Median | 46.8% | 53.7% |
| Interquartile 25% (IQ1) | 44.6% | 50.8% |
| Interquartile 75% (IQ3) | 54.2% | 59.9% |
| Interquartile Range (IQR) | 9.5% | 9.1% |
| Standard Deviation (Sample) | 14.0% | 9.9% |
| Standard Deviation (Population) | 13.9% | 9.8% |
Similar Demographics by Currently Married
Demographics Similar to Panamanians by Currently Married
In terms of currently married, the demographic groups most similar to Panamanians are Immigrants from Portugal (45.2%, a difference of 0.12%), Immigrants from Thailand (45.4%, a difference of 0.24%), Kenyan (45.2%, a difference of 0.24%), Mexican (45.2%, a difference of 0.26%), and Immigrants from Morocco (45.4%, a difference of 0.33%).
| Demographics | Rating | Rank | Currently Married |
| Houma | 7.2 /100 | #211 | Tragic 45.5% |
| Marshallese | 7.2 /100 | #212 | Tragic 45.5% |
| Alaska Natives | 7.0 /100 | #213 | Tragic 45.5% |
| Dutch West Indians | 6.7 /100 | #214 | Tragic 45.5% |
| German Russians | 6.7 /100 | #215 | Tragic 45.5% |
| Immigrants | Morocco | 5.5 /100 | #216 | Tragic 45.4% |
| Immigrants | Thailand | 5.1 /100 | #217 | Tragic 45.4% |
| Panamanians | 4.0 /100 | #218 | Tragic 45.3% |
| Immigrants | Portugal | 3.5 /100 | #219 | Tragic 45.2% |
| Kenyans | 3.1 /100 | #220 | Tragic 45.2% |
| Mexicans | 3.0 /100 | #221 | Tragic 45.2% |
| Immigrants | Azores | 2.5 /100 | #222 | Tragic 45.1% |
| Immigrants | Laos | 2.3 /100 | #223 | Tragic 45.0% |
| Immigrants | Uganda | 2.2 /100 | #224 | Tragic 45.0% |
| French American Indians | 2.2 /100 | #225 | Tragic 45.0% |
Demographics Similar to Norwegians by Currently Married
In terms of currently married, the demographic groups most similar to Norwegians are Immigrants from South Central Asia (50.0%, a difference of 0.34%), Swedish (50.0%, a difference of 0.47%), Danish (50.5%, a difference of 0.54%), Czech (49.9%, a difference of 0.66%), and Filipino (49.7%, a difference of 0.92%).
| Demographics | Rating | Rank | Currently Married |
| Immigrants | India | 100.0 /100 | #1 | Exceptional 51.8% |
| Thais | 100.0 /100 | #2 | Exceptional 50.9% |
| Assyrians/Chaldeans/Syriacs | 100.0 /100 | #3 | Exceptional 50.8% |
| Immigrants | Taiwan | 100.0 /100 | #4 | Exceptional 50.7% |
| Danes | 100.0 /100 | #5 | Exceptional 50.5% |
| Norwegians | 100.0 /100 | #6 | Exceptional 50.2% |
| Immigrants | South Central Asia | 100.0 /100 | #7 | Exceptional 50.0% |
| Swedes | 100.0 /100 | #8 | Exceptional 50.0% |
| Czechs | 99.9 /100 | #9 | Exceptional 49.9% |
| Filipinos | 99.9 /100 | #10 | Exceptional 49.7% |
| English | 99.9 /100 | #11 | Exceptional 49.7% |
| Swiss | 99.9 /100 | #12 | Exceptional 49.7% |
| Dutch | 99.9 /100 | #13 | Exceptional 49.6% |
| Germans | 99.9 /100 | #14 | Exceptional 49.6% |
| Pennsylvania Germans | 99.9 /100 | #15 | Exceptional 49.6% |