Aleut vs Immigrants from Asia Average Family Size
COMPARE
Aleut
Immigrants from Asia
Average Family Size
Average Family Size Comparison
Aleuts
Immigrants from Asia
3.23
AVERAGE FAMILY SIZE
54.1/ 100
METRIC RATING
169th/ 347
METRIC RANK
3.27
AVERAGE FAMILY SIZE
94.0/ 100
METRIC RATING
118th/ 347
METRIC RANK
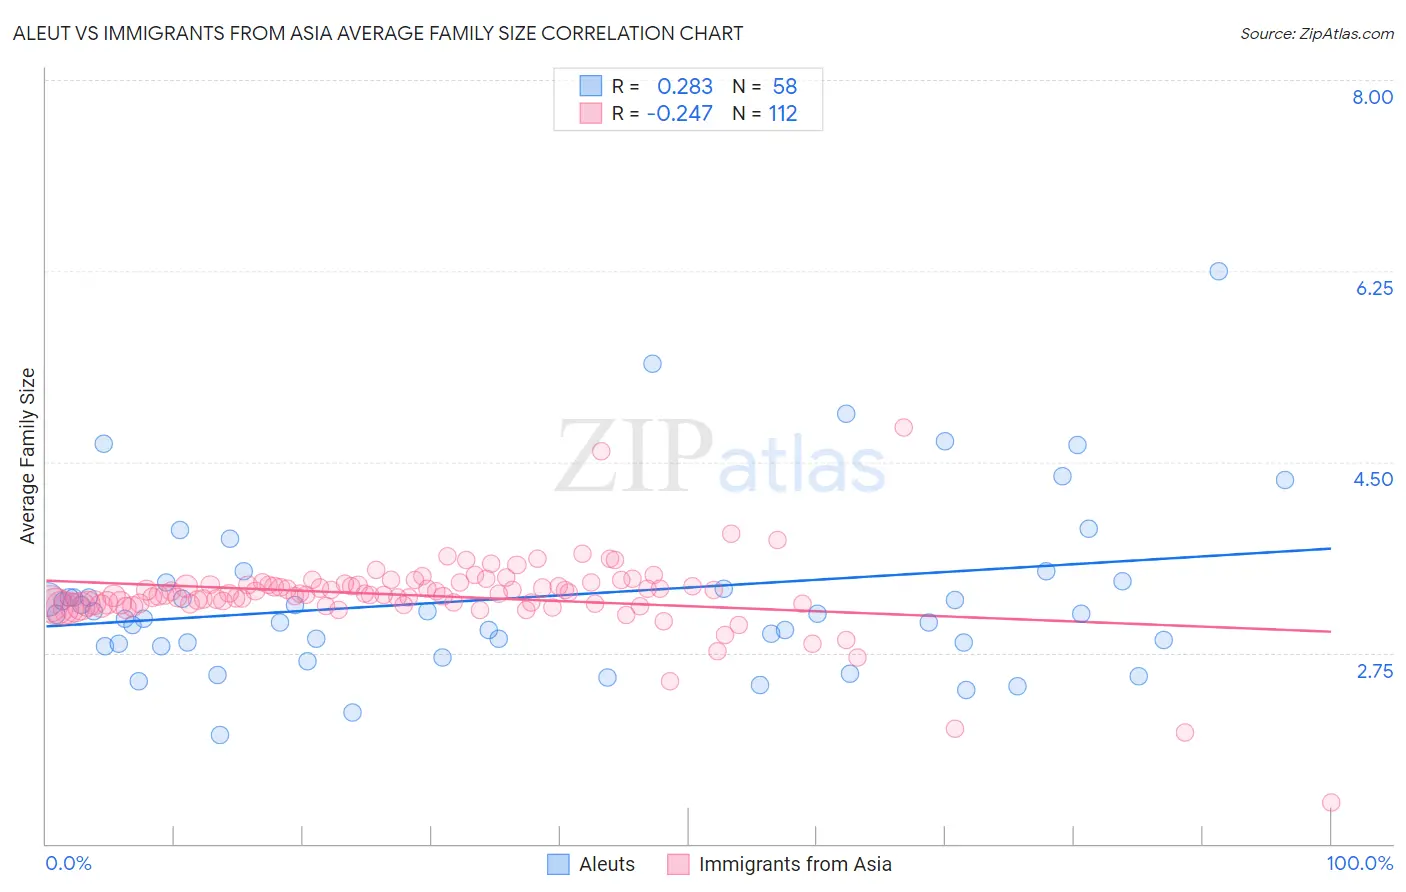
Aleut vs Immigrants from Asia Average Family Size Correlation Chart
The statistical analysis conducted on geographies consisting of 61,774,042 people shows a weak positive correlation between the proportion of Aleuts and average family size in the United States with a correlation coefficient (R) of 0.283 and weighted average of 3.23. Similarly, the statistical analysis conducted on geographies consisting of 548,543,800 people shows a weak negative correlation between the proportion of Immigrants from Asia and average family size in the United States with a correlation coefficient (R) of -0.247 and weighted average of 3.27, a difference of 1.2%.
Average Family Size Correlation Summary
| Measurement | Aleut | Immigrants from Asia |
| Minimum | 2.00 | 1.38 |
| Maximum | 6.25 | 4.82 |
| Range | 4.25 | 3.44 |
| Mean | 3.26 | 3.27 |
| Median | 3.11 | 3.29 |
| Interquartile 25% (IQ1) | 2.84 | 3.20 |
| Interquartile 75% (IQ3) | 3.39 | 3.38 |
| Interquartile Range (IQR) | 0.55 | 0.18 |
| Standard Deviation (Sample) | 0.80 | 0.37 |
| Standard Deviation (Population) | 0.79 | 0.36 |
Similar Demographics by Average Family Size
Demographics Similar to Aleuts by Average Family Size
In terms of average family size, the demographic groups most similar to Aleuts are Taiwanese (3.23, a difference of 0.0%), Arab (3.23, a difference of 0.010%), Chilean (3.23, a difference of 0.020%), Immigrants from Congo (3.23, a difference of 0.030%), and Immigrants from Uruguay (3.23, a difference of 0.040%).
| Demographics | Rating | Rank | Average Family Size |
| Immigrants | Uganda | 60.1 /100 | #162 | Good 3.23 |
| Uruguayans | 58.8 /100 | #163 | Average 3.23 |
| Egyptians | 58.6 /100 | #164 | Average 3.23 |
| Ugandans | 58.4 /100 | #165 | Average 3.23 |
| Immigrants | Senegal | 57.5 /100 | #166 | Average 3.23 |
| Dutch West Indians | 56.9 /100 | #167 | Average 3.23 |
| Taiwanese | 54.2 /100 | #168 | Average 3.23 |
| Aleuts | 54.1 /100 | #169 | Average 3.23 |
| Arabs | 53.8 /100 | #170 | Average 3.23 |
| Chileans | 53.2 /100 | #171 | Average 3.23 |
| Immigrants | Congo | 52.7 /100 | #172 | Average 3.23 |
| Immigrants | Uruguay | 52.0 /100 | #173 | Average 3.23 |
| Immigrants | South Central Asia | 50.0 /100 | #174 | Average 3.23 |
| Immigrants | China | 49.9 /100 | #175 | Average 3.23 |
| Israelis | 48.7 /100 | #176 | Average 3.23 |
Demographics Similar to Immigrants from Asia by Average Family Size
In terms of average family size, the demographic groups most similar to Immigrants from Asia are Immigrants from Indonesia (3.27, a difference of 0.020%), Immigrants from Bahamas (3.27, a difference of 0.030%), Immigrants from Thailand (3.27, a difference of 0.050%), Kiowa (3.27, a difference of 0.070%), and Immigrants from Liberia (3.27, a difference of 0.090%).
| Demographics | Rating | Rank | Average Family Size |
| Indonesians | 96.2 /100 | #111 | Exceptional 3.28 |
| Blacks/African Americans | 95.7 /100 | #112 | Exceptional 3.27 |
| Immigrants | Panama | 95.6 /100 | #113 | Exceptional 3.27 |
| South Americans | 95.1 /100 | #114 | Exceptional 3.27 |
| Immigrants | Liberia | 95.0 /100 | #115 | Exceptional 3.27 |
| Immigrants | South America | 95.0 /100 | #116 | Exceptional 3.27 |
| Kiowa | 94.8 /100 | #117 | Exceptional 3.27 |
| Immigrants | Asia | 94.0 /100 | #118 | Exceptional 3.27 |
| Immigrants | Indonesia | 93.7 /100 | #119 | Exceptional 3.27 |
| Immigrants | Bahamas | 93.6 /100 | #120 | Exceptional 3.27 |
| Immigrants | Thailand | 93.3 /100 | #121 | Exceptional 3.27 |
| Immigrants | Colombia | 92.8 /100 | #122 | Exceptional 3.27 |
| Alaskan Athabascans | 92.4 /100 | #123 | Exceptional 3.27 |
| South American Indians | 91.6 /100 | #124 | Exceptional 3.26 |
| Immigrants | Cuba | 91.3 /100 | #125 | Exceptional 3.26 |