Immigrants from South Africa vs West Indian Average Family Size
COMPARE
Immigrants from South Africa
West Indian
Average Family Size
Average Family Size Comparison
Immigrants from South Africa
West Indians
3.16
AVERAGE FAMILY SIZE
0.9/ 100
METRIC RATING
265th/ 347
METRIC RANK
3.29
AVERAGE FAMILY SIZE
98.5/ 100
METRIC RATING
102nd/ 347
METRIC RANK
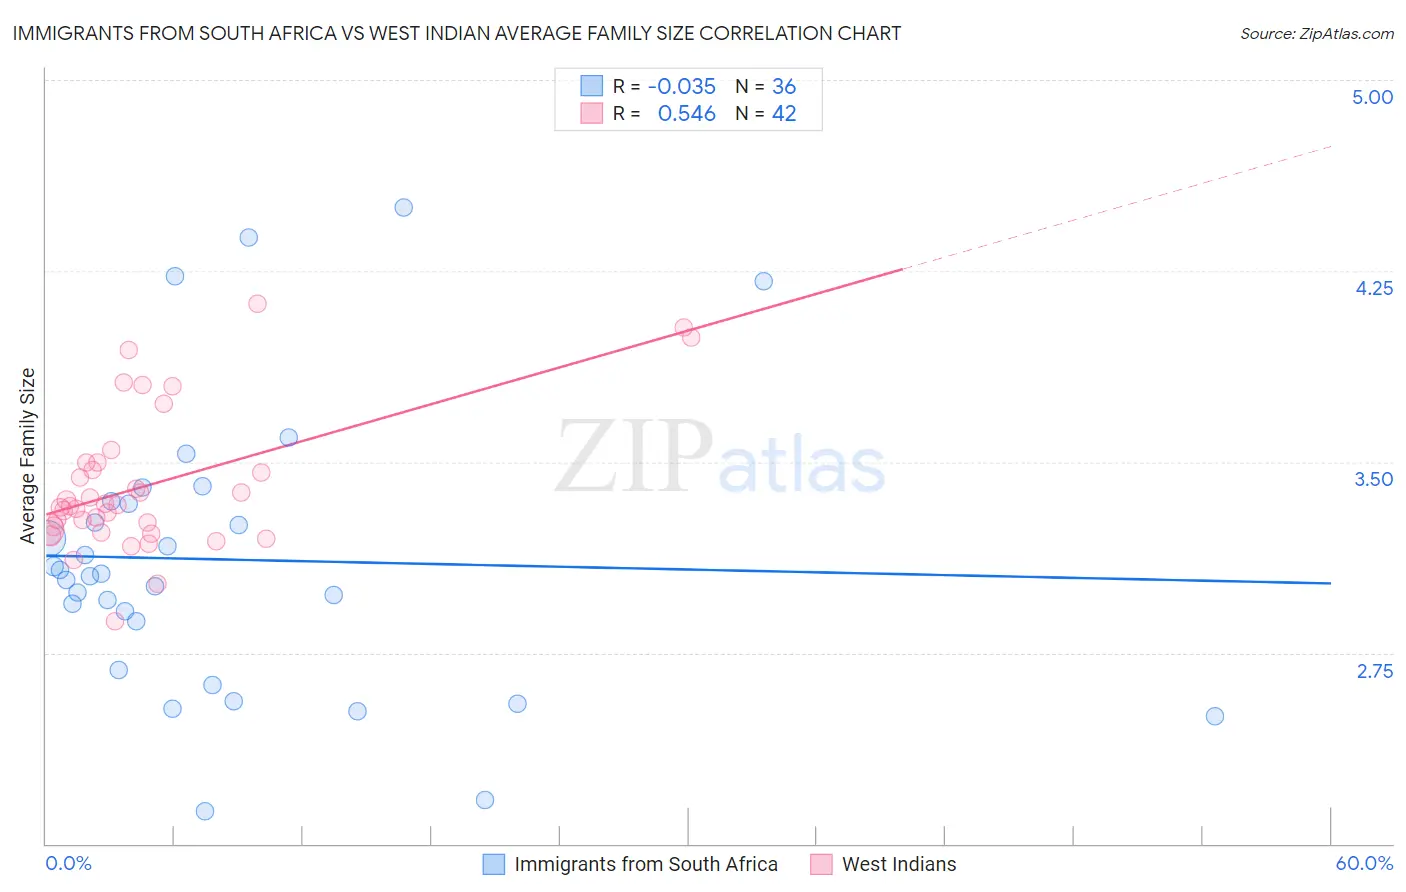
Immigrants from South Africa vs West Indian Average Family Size Correlation Chart
The statistical analysis conducted on geographies consisting of 233,270,414 people shows no correlation between the proportion of Immigrants from South Africa and average family size in the United States with a correlation coefficient (R) of -0.035 and weighted average of 3.16. Similarly, the statistical analysis conducted on geographies consisting of 253,859,351 people shows a substantial positive correlation between the proportion of West Indians and average family size in the United States with a correlation coefficient (R) of 0.546 and weighted average of 3.29, a difference of 4.2%.
Average Family Size Correlation Summary
| Measurement | Immigrants from South Africa | West Indian |
| Minimum | 2.13 | 2.87 |
| Maximum | 4.50 | 4.12 |
| Range | 2.37 | 1.25 |
| Mean | 3.12 | 3.41 |
| Median | 3.06 | 3.33 |
| Interquartile 25% (IQ1) | 2.78 | 3.23 |
| Interquartile 75% (IQ3) | 3.34 | 3.50 |
| Interquartile Range (IQR) | 0.56 | 0.26 |
| Standard Deviation (Sample) | 0.56 | 0.28 |
| Standard Deviation (Population) | 0.55 | 0.27 |
Similar Demographics by Average Family Size
Demographics Similar to Immigrants from South Africa by Average Family Size
In terms of average family size, the demographic groups most similar to Immigrants from South Africa are Immigrants from Greece (3.16, a difference of 0.010%), Iroquois (3.16, a difference of 0.030%), American (3.16, a difference of 0.050%), Immigrants from Bulgaria (3.16, a difference of 0.070%), and Maltese (3.16, a difference of 0.080%).
| Demographics | Rating | Rank | Average Family Size |
| Turks | 1.3 /100 | #258 | Tragic 3.16 |
| Potawatomi | 1.3 /100 | #259 | Tragic 3.16 |
| Immigrants | Albania | 1.3 /100 | #260 | Tragic 3.16 |
| Immigrants | North Macedonia | 1.3 /100 | #261 | Tragic 3.16 |
| Immigrants | Russia | 1.3 /100 | #262 | Tragic 3.16 |
| Immigrants | Bulgaria | 1.0 /100 | #263 | Tragic 3.16 |
| Americans | 1.0 /100 | #264 | Tragic 3.16 |
| Immigrants | South Africa | 0.9 /100 | #265 | Tragic 3.16 |
| Immigrants | Greece | 0.9 /100 | #266 | Tragic 3.16 |
| Iroquois | 0.8 /100 | #267 | Tragic 3.16 |
| Maltese | 0.8 /100 | #268 | Tragic 3.16 |
| Immigrants | Singapore | 0.7 /100 | #269 | Tragic 3.16 |
| Tlingit-Haida | 0.7 /100 | #270 | Tragic 3.16 |
| Immigrants | Germany | 0.7 /100 | #271 | Tragic 3.15 |
| Immigrants | Lithuania | 0.6 /100 | #272 | Tragic 3.15 |
Demographics Similar to West Indians by Average Family Size
In terms of average family size, the demographic groups most similar to West Indians are Immigrants from Burma/Myanmar (3.29, a difference of 0.010%), Guamanian/Chamorro (3.29, a difference of 0.020%), Barbadian (3.29, a difference of 0.030%), Nigerian (3.29, a difference of 0.030%), and Immigrants from Western Africa (3.29, a difference of 0.030%).
| Demographics | Rating | Rank | Average Family Size |
| Immigrants | Lebanon | 99.0 /100 | #95 | Exceptional 3.30 |
| U.S. Virgin Islanders | 98.8 /100 | #96 | Exceptional 3.29 |
| Immigrants | Oceania | 98.7 /100 | #97 | Exceptional 3.29 |
| Barbadians | 98.6 /100 | #98 | Exceptional 3.29 |
| Nigerians | 98.6 /100 | #99 | Exceptional 3.29 |
| Guamanians/Chamorros | 98.6 /100 | #100 | Exceptional 3.29 |
| Immigrants | Burma/Myanmar | 98.6 /100 | #101 | Exceptional 3.29 |
| West Indians | 98.5 /100 | #102 | Exceptional 3.29 |
| Immigrants | Western Africa | 98.4 /100 | #103 | Exceptional 3.29 |
| Bolivians | 98.3 /100 | #104 | Exceptional 3.29 |
| Immigrants | Ghana | 98.1 /100 | #105 | Exceptional 3.29 |
| Paiute | 98.0 /100 | #106 | Exceptional 3.29 |
| Ghanaians | 98.0 /100 | #107 | Exceptional 3.29 |
| Asians | 97.0 /100 | #108 | Exceptional 3.28 |
| Puerto Ricans | 96.7 /100 | #109 | Exceptional 3.28 |