Palestinian vs Immigrants from Chile 2nd Grade
COMPARE
Palestinian
Immigrants from Chile
2nd Grade
2nd Grade Comparison
Palestinians
Immigrants from Chile
98.0%
2ND GRADE
83.9/ 100
METRIC RATING
140th/ 347
METRIC RANK
97.7%
2ND GRADE
17.3/ 100
METRIC RATING
206th/ 347
METRIC RANK
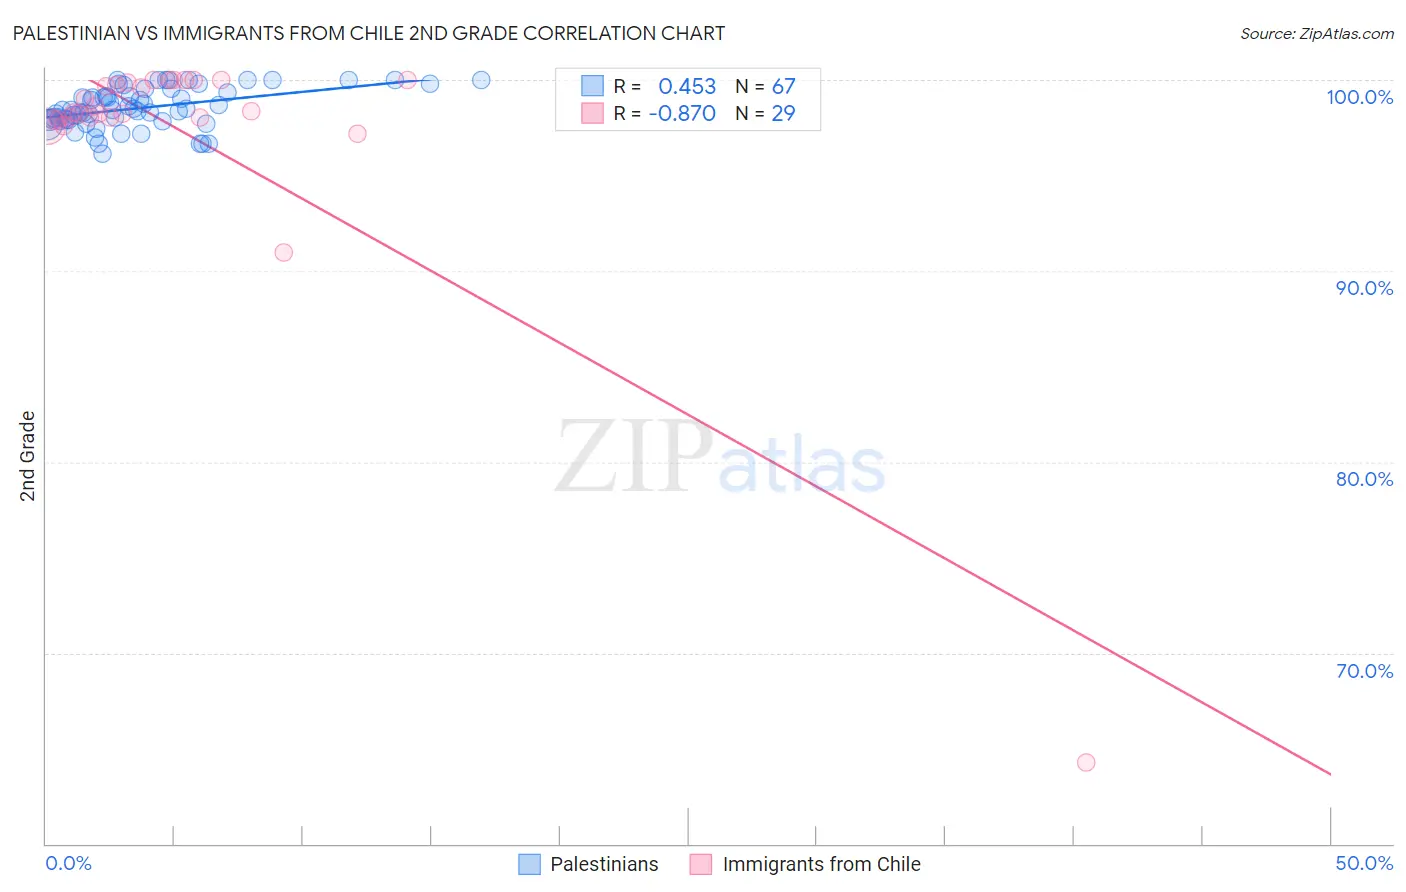
Palestinian vs Immigrants from Chile 2nd Grade Correlation Chart
The statistical analysis conducted on geographies consisting of 216,457,008 people shows a moderate positive correlation between the proportion of Palestinians and percentage of population with at least 2nd grade education in the United States with a correlation coefficient (R) of 0.453 and weighted average of 98.0%. Similarly, the statistical analysis conducted on geographies consisting of 218,647,266 people shows a very strong negative correlation between the proportion of Immigrants from Chile and percentage of population with at least 2nd grade education in the United States with a correlation coefficient (R) of -0.870 and weighted average of 97.7%, a difference of 0.25%.
2nd Grade Correlation Summary
| Measurement | Palestinian | Immigrants from Chile |
| Minimum | 96.1% | 64.3% |
| Maximum | 100.0% | 100.0% |
| Range | 3.9% | 35.7% |
| Mean | 98.5% | 97.4% |
| Median | 98.4% | 98.3% |
| Interquartile 25% (IQ1) | 97.9% | 98.0% |
| Interquartile 75% (IQ3) | 99.4% | 99.9% |
| Interquartile Range (IQR) | 1.4% | 1.9% |
| Standard Deviation (Sample) | 1.0% | 6.6% |
| Standard Deviation (Population) | 1.0% | 6.5% |
Similar Demographics by 2nd Grade
Demographics Similar to Palestinians by 2nd Grade
In terms of 2nd grade, the demographic groups most similar to Palestinians are Immigrants from Turkey (98.0%, a difference of 0.010%), Blackfeet (98.0%, a difference of 0.020%), Burmese (98.0%, a difference of 0.020%), Alsatian (98.0%, a difference of 0.020%), and Hmong (98.0%, a difference of 0.020%).
| Demographics | Rating | Rank | 2nd Grade |
| Cambodians | 90.7 /100 | #133 | Exceptional 98.0% |
| Immigrants | Hungary | 89.7 /100 | #134 | Excellent 98.0% |
| Immigrants | Bulgaria | 89.7 /100 | #135 | Excellent 98.0% |
| Immigrants | Kuwait | 89.2 /100 | #136 | Excellent 98.0% |
| Immigrants | Romania | 88.3 /100 | #137 | Excellent 98.0% |
| Israelis | 87.9 /100 | #138 | Excellent 98.0% |
| Blackfeet | 87.5 /100 | #139 | Excellent 98.0% |
| Palestinians | 83.9 /100 | #140 | Excellent 98.0% |
| Immigrants | Turkey | 83.0 /100 | #141 | Excellent 98.0% |
| Burmese | 81.0 /100 | #142 | Excellent 98.0% |
| Alsatians | 80.5 /100 | #143 | Excellent 98.0% |
| Hmong | 80.0 /100 | #144 | Good 98.0% |
| Filipinos | 79.2 /100 | #145 | Good 98.0% |
| Immigrants | Israel | 78.0 /100 | #146 | Good 98.0% |
| Immigrants | Greece | 76.8 /100 | #147 | Good 98.0% |
Demographics Similar to Immigrants from Chile by 2nd Grade
In terms of 2nd grade, the demographic groups most similar to Immigrants from Chile are Immigrants from Southern Europe (97.8%, a difference of 0.0%), Yuman (97.8%, a difference of 0.010%), Immigrants from Albania (97.8%, a difference of 0.010%), African (97.7%, a difference of 0.010%), and Immigrants from Lebanon (97.8%, a difference of 0.020%).
| Demographics | Rating | Rank | 2nd Grade |
| Immigrants | Egypt | 24.4 /100 | #199 | Fair 97.8% |
| Immigrants | Lebanon | 20.9 /100 | #200 | Fair 97.8% |
| Tohono O'odham | 20.9 /100 | #201 | Fair 97.8% |
| Immigrants | Ukraine | 20.5 /100 | #202 | Fair 97.8% |
| Yuman | 20.0 /100 | #203 | Fair 97.8% |
| Immigrants | Albania | 18.4 /100 | #204 | Poor 97.8% |
| Immigrants | Southern Europe | 18.1 /100 | #205 | Poor 97.8% |
| Immigrants | Chile | 17.3 /100 | #206 | Poor 97.7% |
| Africans | 15.6 /100 | #207 | Poor 97.7% |
| Immigrants | Northern Africa | 12.3 /100 | #208 | Poor 97.7% |
| Immigrants | Oceania | 10.9 /100 | #209 | Poor 97.7% |
| Costa Ricans | 10.5 /100 | #210 | Poor 97.7% |
| Laotians | 9.9 /100 | #211 | Tragic 97.7% |
| Immigrants | Bahamas | 8.4 /100 | #212 | Tragic 97.7% |
| Moroccans | 8.2 /100 | #213 | Tragic 97.7% |