Immigrants from Eritrea vs Immigrants from Chile Average Family Size
COMPARE
Immigrants from Eritrea
Immigrants from Chile
Average Family Size
Average Family Size Comparison
Immigrants from Eritrea
Immigrants from Chile
3.24
AVERAGE FAMILY SIZE
71.4/ 100
METRIC RATING
153rd/ 347
METRIC RANK
3.24
AVERAGE FAMILY SIZE
63.2/ 100
METRIC RATING
161st/ 347
METRIC RANK
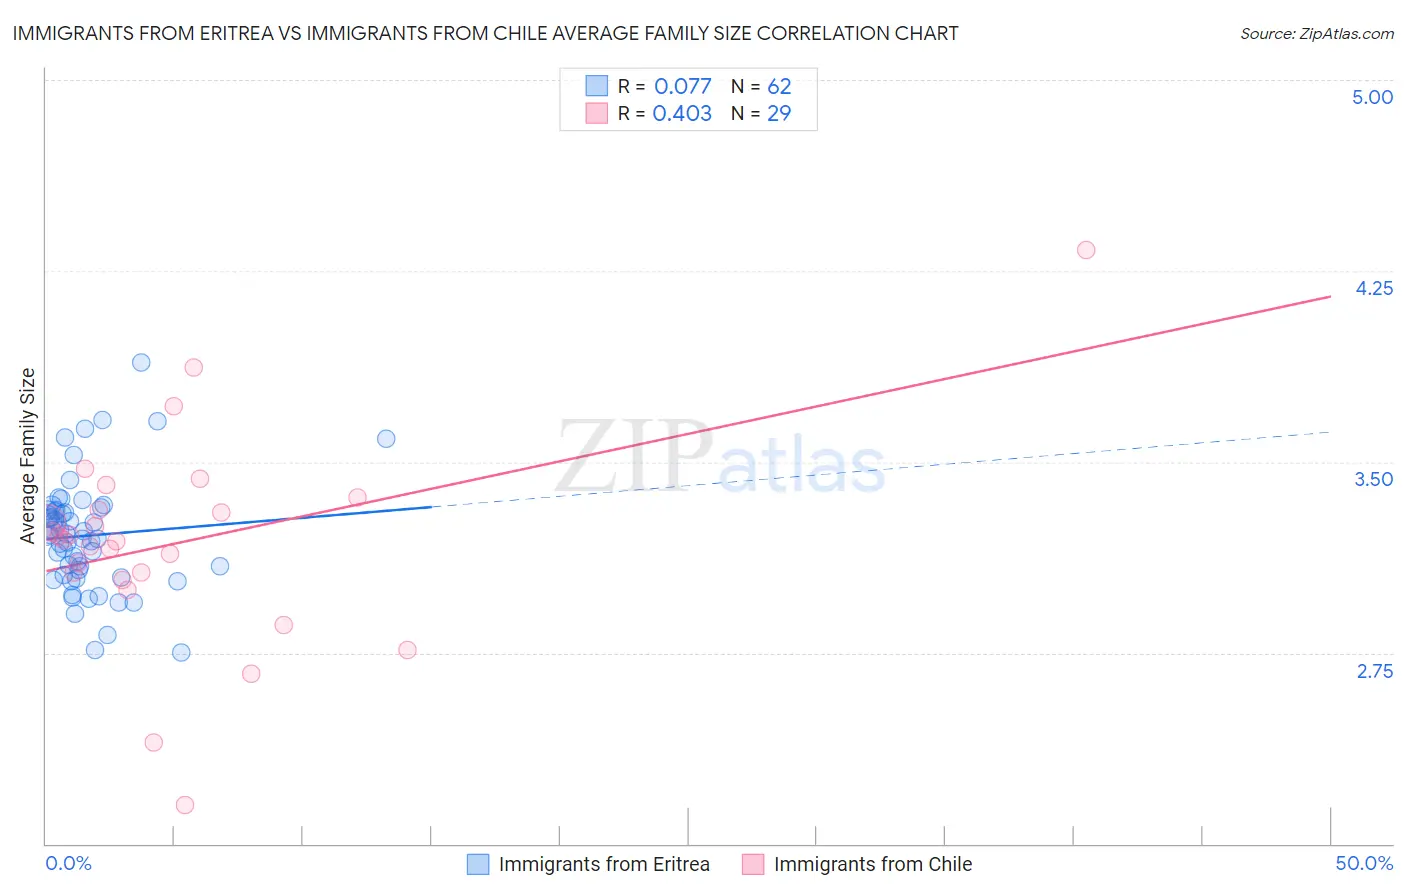
Immigrants from Eritrea vs Immigrants from Chile Average Family Size Correlation Chart
The statistical analysis conducted on geographies consisting of 104,794,375 people shows a slight positive correlation between the proportion of Immigrants from Eritrea and average family size in the United States with a correlation coefficient (R) of 0.077 and weighted average of 3.24. Similarly, the statistical analysis conducted on geographies consisting of 218,601,267 people shows a moderate positive correlation between the proportion of Immigrants from Chile and average family size in the United States with a correlation coefficient (R) of 0.403 and weighted average of 3.24, a difference of 0.17%.
Average Family Size Correlation Summary
| Measurement | Immigrants from Eritrea | Immigrants from Chile |
| Minimum | 2.75 | 2.15 |
| Maximum | 3.89 | 4.33 |
| Range | 1.14 | 2.18 |
| Mean | 3.21 | 3.18 |
| Median | 3.21 | 3.19 |
| Interquartile 25% (IQ1) | 3.05 | 3.05 |
| Interquartile 75% (IQ3) | 3.31 | 3.34 |
| Interquartile Range (IQR) | 0.25 | 0.29 |
| Standard Deviation (Sample) | 0.22 | 0.41 |
| Standard Deviation (Population) | 0.22 | 0.40 |
Demographics Similar to Immigrants from Eritrea and Immigrants from Chile by Average Family Size
In terms of average family size, the demographic groups most similar to Immigrants from Eritrea are Spanish American (3.24, a difference of 0.020%), Immigrants from Egypt (3.24, a difference of 0.030%), Assyrian/Chaldean/Syriac (3.24, a difference of 0.050%), Indian (Asian) (3.24, a difference of 0.050%), and Jordanian (3.24, a difference of 0.050%). Similarly, the demographic groups most similar to Immigrants from Chile are Ethiopian (3.24, a difference of 0.010%), Immigrants from Iraq (3.24, a difference of 0.010%), Iraqi (3.24, a difference of 0.020%), Immigrants from Uganda (3.23, a difference of 0.060%), and Immigrants from Uzbekistan (3.24, a difference of 0.080%).
| Demographics | Rating | Rank | Average Family Size |
| Immigrants | Jordan | 75.7 /100 | #147 | Good 3.24 |
| Blackfeet | 75.0 /100 | #148 | Good 3.24 |
| Assyrians/Chaldeans/Syriacs | 73.8 /100 | #149 | Good 3.24 |
| Indians (Asian) | 73.6 /100 | #150 | Good 3.24 |
| Jordanians | 73.5 /100 | #151 | Good 3.24 |
| Spanish Americans | 72.5 /100 | #152 | Good 3.24 |
| Immigrants | Eritrea | 71.4 /100 | #153 | Good 3.24 |
| Immigrants | Egypt | 70.0 /100 | #154 | Good 3.24 |
| Seminole | 68.2 /100 | #155 | Good 3.24 |
| Immigrants | Taiwan | 68.1 /100 | #156 | Good 3.24 |
| Immigrants | Uzbekistan | 67.0 /100 | #157 | Good 3.24 |
| Iraqis | 64.3 /100 | #158 | Good 3.24 |
| Ethiopians | 63.9 /100 | #159 | Good 3.24 |
| Immigrants | Iraq | 63.7 /100 | #160 | Good 3.24 |
| Immigrants | Chile | 63.2 /100 | #161 | Good 3.24 |
| Immigrants | Uganda | 60.1 /100 | #162 | Good 3.23 |
| Uruguayans | 58.8 /100 | #163 | Average 3.23 |
| Egyptians | 58.6 /100 | #164 | Average 3.23 |
| Ugandans | 58.4 /100 | #165 | Average 3.23 |
| Immigrants | Senegal | 57.5 /100 | #166 | Average 3.23 |
| Dutch West Indians | 56.9 /100 | #167 | Average 3.23 |