Paiute vs Immigrants from Grenada Single Mother Households
COMPARE
Paiute
Immigrants from Grenada
Single Mother Households
Single Mother Households Comparison
Paiute
Immigrants from Grenada
7.0%
SINGLE MOTHER HOUSEHOLDS
2.4/ 100
METRIC RATING
226th/ 347
METRIC RANK
8.2%
SINGLE MOTHER HOUSEHOLDS
0.0/ 100
METRIC RATING
313th/ 347
METRIC RANK
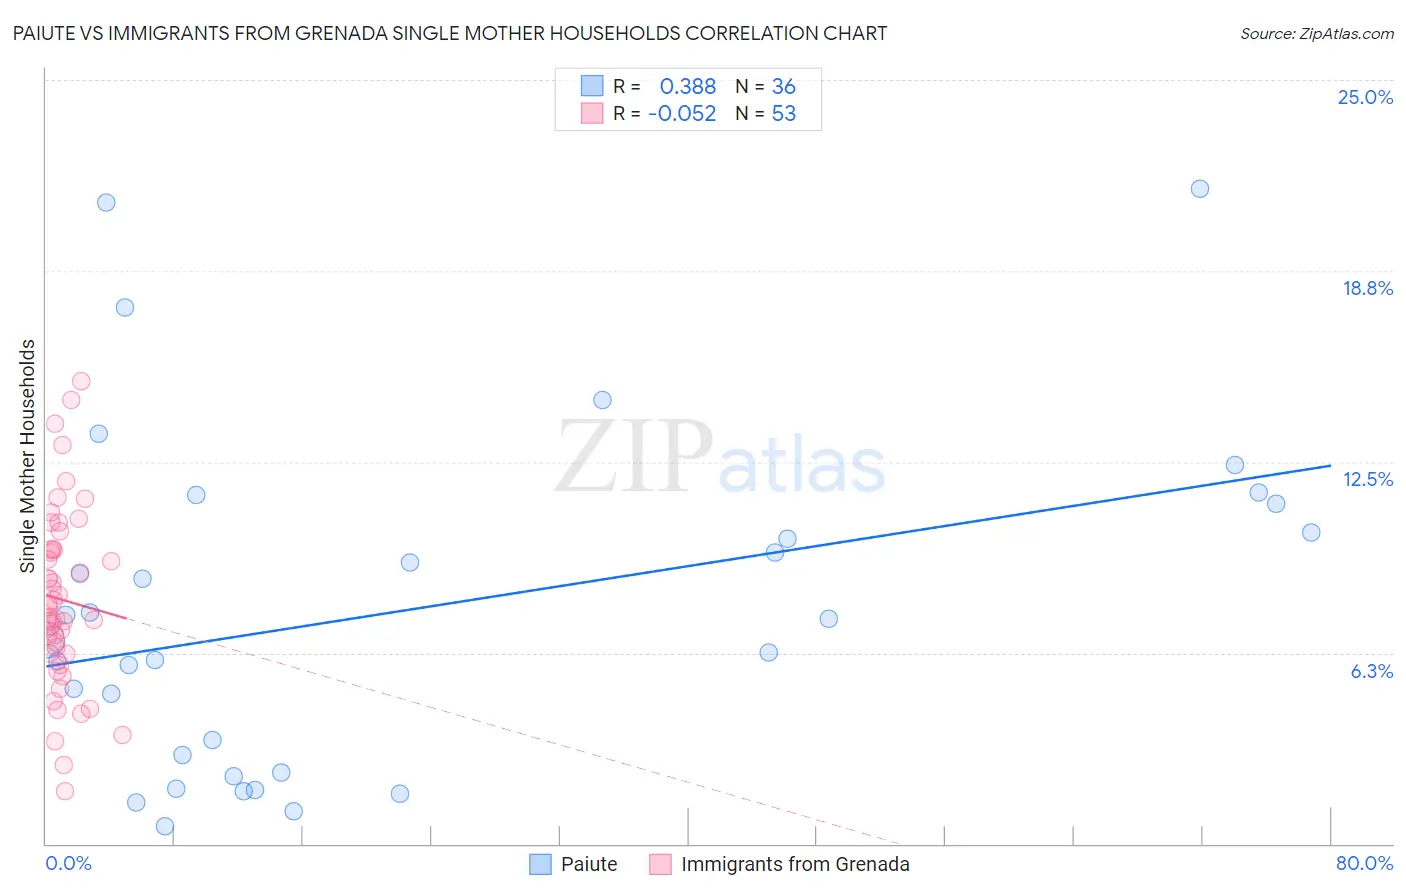
Paiute vs Immigrants from Grenada Single Mother Households Correlation Chart
The statistical analysis conducted on geographies consisting of 58,356,000 people shows a mild positive correlation between the proportion of Paiute and percentage of single mother households in the United States with a correlation coefficient (R) of 0.388 and weighted average of 7.0%. Similarly, the statistical analysis conducted on geographies consisting of 67,162,993 people shows a slight negative correlation between the proportion of Immigrants from Grenada and percentage of single mother households in the United States with a correlation coefficient (R) of -0.052 and weighted average of 8.2%, a difference of 17.3%.
Single Mother Households Correlation Summary
| Measurement | Paiute | Immigrants from Grenada |
| Minimum | 0.59% | 1.7% |
| Maximum | 21.4% | 15.1% |
| Range | 20.8% | 13.4% |
| Mean | 7.6% | 8.0% |
| Median | 7.0% | 7.8% |
| Interquartile 25% (IQ1) | 2.6% | 6.2% |
| Interquartile 75% (IQ3) | 10.7% | 9.6% |
| Interquartile Range (IQR) | 8.0% | 3.4% |
| Standard Deviation (Sample) | 5.4% | 2.9% |
| Standard Deviation (Population) | 5.3% | 2.9% |
Similar Demographics by Single Mother Households
Demographics Similar to Paiute by Single Mother Households
In terms of single mother households, the demographic groups most similar to Paiute are Kenyan (7.0%, a difference of 0.14%), Iroquois (7.0%, a difference of 0.17%), Immigrants from Kenya (7.0%, a difference of 0.34%), Sudanese (6.9%, a difference of 0.68%), and Immigrants from Sudan (6.9%, a difference of 0.96%).
| Demographics | Rating | Rank | Single Mother Households |
| Immigrants | Immigrants | 4.3 /100 | #219 | Tragic 6.8% |
| Immigrants | Thailand | 4.0 /100 | #220 | Tragic 6.9% |
| French American Indians | 3.7 /100 | #221 | Tragic 6.9% |
| Immigrants | Bangladesh | 3.7 /100 | #222 | Tragic 6.9% |
| Immigrants | Micronesia | 3.6 /100 | #223 | Tragic 6.9% |
| Immigrants | Sudan | 3.5 /100 | #224 | Tragic 6.9% |
| Sudanese | 3.1 /100 | #225 | Tragic 6.9% |
| Paiute | 2.4 /100 | #226 | Tragic 7.0% |
| Kenyans | 2.3 /100 | #227 | Tragic 7.0% |
| Iroquois | 2.2 /100 | #228 | Tragic 7.0% |
| Immigrants | Kenya | 2.1 /100 | #229 | Tragic 7.0% |
| Creek | 1.6 /100 | #230 | Tragic 7.0% |
| Spanish Americans | 1.6 /100 | #231 | Tragic 7.0% |
| Comanche | 1.5 /100 | #232 | Tragic 7.0% |
| Choctaw | 1.4 /100 | #233 | Tragic 7.0% |
Demographics Similar to Immigrants from Grenada by Single Mother Households
In terms of single mother households, the demographic groups most similar to Immigrants from Grenada are Immigrants from Mexico (8.2%, a difference of 0.12%), Immigrants from Western Africa (8.2%, a difference of 0.15%), Bangladeshi (8.1%, a difference of 0.16%), African (8.2%, a difference of 0.29%), and Immigrants from Honduras (8.2%, a difference of 0.43%).
| Demographics | Rating | Rank | Single Mother Households |
| Immigrants | Barbados | 0.0 /100 | #306 | Tragic 8.0% |
| Immigrants | St. Vincent and the Grenadines | 0.0 /100 | #307 | Tragic 8.0% |
| Immigrants | Central America | 0.0 /100 | #308 | Tragic 8.1% |
| Cheyenne | 0.0 /100 | #309 | Tragic 8.1% |
| Hondurans | 0.0 /100 | #310 | Tragic 8.1% |
| Immigrants | Congo | 0.0 /100 | #311 | Tragic 8.1% |
| Bangladeshis | 0.0 /100 | #312 | Tragic 8.1% |
| Immigrants | Grenada | 0.0 /100 | #313 | Tragic 8.2% |
| Immigrants | Mexico | 0.0 /100 | #314 | Tragic 8.2% |
| Immigrants | Western Africa | 0.0 /100 | #315 | Tragic 8.2% |
| Africans | 0.0 /100 | #316 | Tragic 8.2% |
| Immigrants | Honduras | 0.0 /100 | #317 | Tragic 8.2% |
| Senegalese | 0.0 /100 | #318 | Tragic 8.2% |
| Jamaicans | 0.0 /100 | #319 | Tragic 8.2% |
| Bahamians | 0.0 /100 | #320 | Tragic 8.3% |