Paiute vs Eastern European Single Mother Households
COMPARE
Paiute
Eastern European
Single Mother Households
Single Mother Households Comparison
Paiute
Eastern Europeans
7.0%
SINGLE MOTHER HOUSEHOLDS
2.4/ 100
METRIC RATING
226th/ 347
METRIC RANK
5.2%
SINGLE MOTHER HOUSEHOLDS
99.8/ 100
METRIC RATING
21st/ 347
METRIC RANK
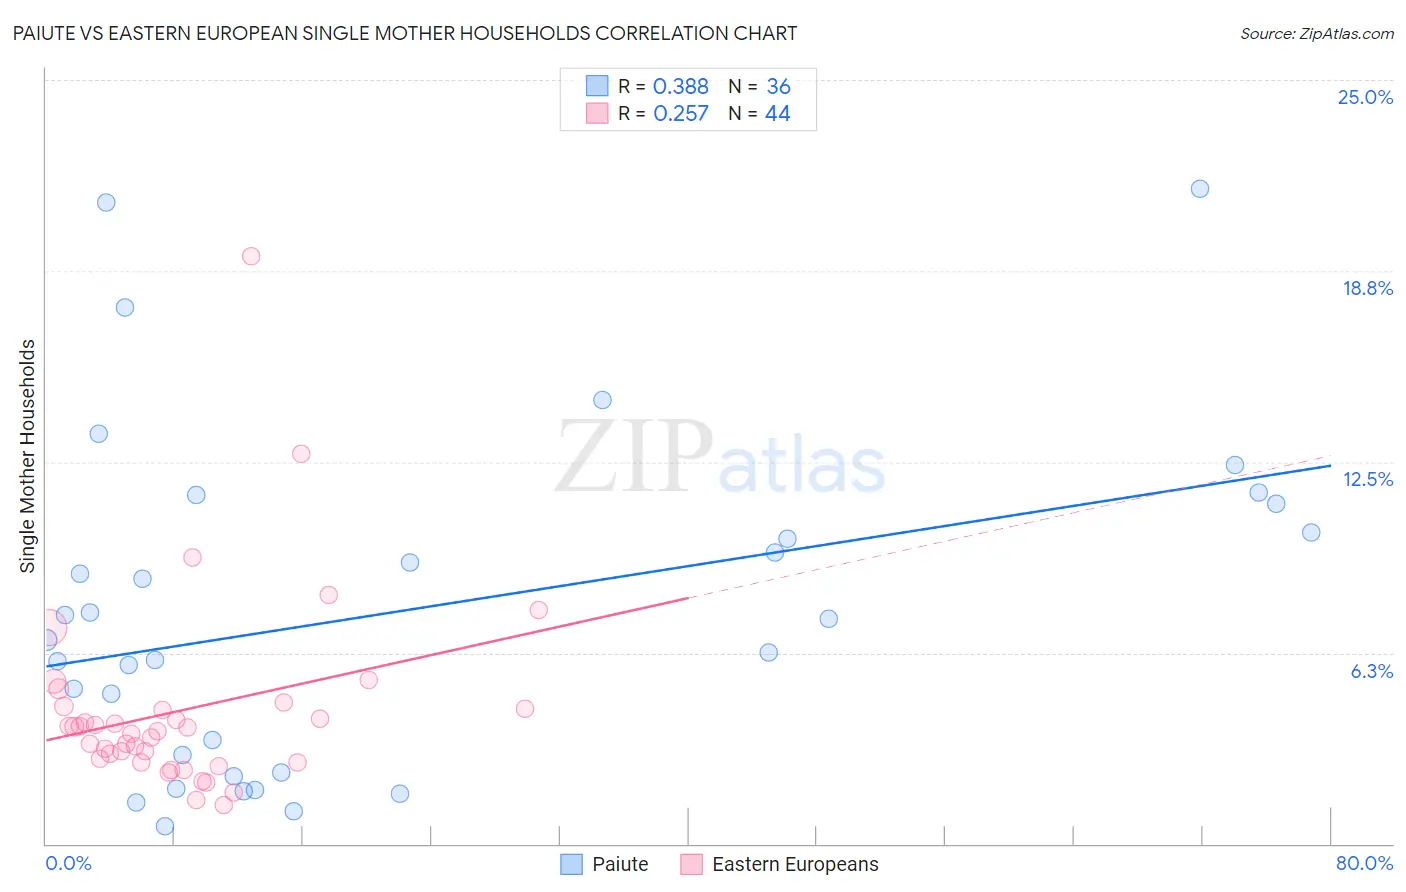
Paiute vs Eastern European Single Mother Households Correlation Chart
The statistical analysis conducted on geographies consisting of 58,356,000 people shows a mild positive correlation between the proportion of Paiute and percentage of single mother households in the United States with a correlation coefficient (R) of 0.388 and weighted average of 7.0%. Similarly, the statistical analysis conducted on geographies consisting of 459,026,965 people shows a weak positive correlation between the proportion of Eastern Europeans and percentage of single mother households in the United States with a correlation coefficient (R) of 0.257 and weighted average of 5.2%, a difference of 34.0%.
Single Mother Households Correlation Summary
| Measurement | Paiute | Eastern European |
| Minimum | 0.59% | 1.3% |
| Maximum | 21.4% | 19.2% |
| Range | 20.8% | 18.0% |
| Mean | 7.6% | 4.4% |
| Median | 7.0% | 3.8% |
| Interquartile 25% (IQ1) | 2.6% | 2.7% |
| Interquartile 75% (IQ3) | 10.7% | 4.5% |
| Interquartile Range (IQR) | 8.0% | 1.7% |
| Standard Deviation (Sample) | 5.4% | 3.1% |
| Standard Deviation (Population) | 5.3% | 3.1% |
Similar Demographics by Single Mother Households
Demographics Similar to Paiute by Single Mother Households
In terms of single mother households, the demographic groups most similar to Paiute are Kenyan (7.0%, a difference of 0.14%), Iroquois (7.0%, a difference of 0.17%), Immigrants from Kenya (7.0%, a difference of 0.34%), Sudanese (6.9%, a difference of 0.68%), and Immigrants from Sudan (6.9%, a difference of 0.96%).
| Demographics | Rating | Rank | Single Mother Households |
| Immigrants | Immigrants | 4.3 /100 | #219 | Tragic 6.8% |
| Immigrants | Thailand | 4.0 /100 | #220 | Tragic 6.9% |
| French American Indians | 3.7 /100 | #221 | Tragic 6.9% |
| Immigrants | Bangladesh | 3.7 /100 | #222 | Tragic 6.9% |
| Immigrants | Micronesia | 3.6 /100 | #223 | Tragic 6.9% |
| Immigrants | Sudan | 3.5 /100 | #224 | Tragic 6.9% |
| Sudanese | 3.1 /100 | #225 | Tragic 6.9% |
| Paiute | 2.4 /100 | #226 | Tragic 7.0% |
| Kenyans | 2.3 /100 | #227 | Tragic 7.0% |
| Iroquois | 2.2 /100 | #228 | Tragic 7.0% |
| Immigrants | Kenya | 2.1 /100 | #229 | Tragic 7.0% |
| Creek | 1.6 /100 | #230 | Tragic 7.0% |
| Spanish Americans | 1.6 /100 | #231 | Tragic 7.0% |
| Comanche | 1.5 /100 | #232 | Tragic 7.0% |
| Choctaw | 1.4 /100 | #233 | Tragic 7.0% |
Demographics Similar to Eastern Europeans by Single Mother Households
In terms of single mother households, the demographic groups most similar to Eastern Europeans are Maltese (5.2%, a difference of 0.060%), Chinese (5.2%, a difference of 0.53%), Immigrants from Armenia (5.2%, a difference of 0.63%), Thai (5.2%, a difference of 0.72%), and Immigrants from Austria (5.2%, a difference of 0.77%).
| Demographics | Rating | Rank | Single Mother Households |
| Immigrants | Australia | 99.9 /100 | #14 | Exceptional 5.1% |
| Immigrants | Eastern Asia | 99.9 /100 | #15 | Exceptional 5.1% |
| Indians (Asian) | 99.9 /100 | #16 | Exceptional 5.1% |
| Soviet Union | 99.9 /100 | #17 | Exceptional 5.1% |
| Immigrants | Armenia | 99.9 /100 | #18 | Exceptional 5.2% |
| Chinese | 99.9 /100 | #19 | Exceptional 5.2% |
| Maltese | 99.9 /100 | #20 | Exceptional 5.2% |
| Eastern Europeans | 99.8 /100 | #21 | Exceptional 5.2% |
| Thais | 99.8 /100 | #22 | Exceptional 5.2% |
| Immigrants | Austria | 99.8 /100 | #23 | Exceptional 5.2% |
| Armenians | 99.8 /100 | #24 | Exceptional 5.2% |
| Immigrants | Japan | 99.8 /100 | #25 | Exceptional 5.2% |
| Immigrants | Lithuania | 99.8 /100 | #26 | Exceptional 5.3% |
| Bhutanese | 99.7 /100 | #27 | Exceptional 5.3% |
| Russians | 99.7 /100 | #28 | Exceptional 5.3% |