Liberian vs Immigrants from Grenada Single Mother Households
COMPARE
Liberian
Immigrants from Grenada
Single Mother Households
Single Mother Households Comparison
Liberians
Immigrants from Grenada
8.6%
SINGLE MOTHER HOUSEHOLDS
0.0/ 100
METRIC RATING
333rd/ 347
METRIC RANK
8.2%
SINGLE MOTHER HOUSEHOLDS
0.0/ 100
METRIC RATING
313th/ 347
METRIC RANK
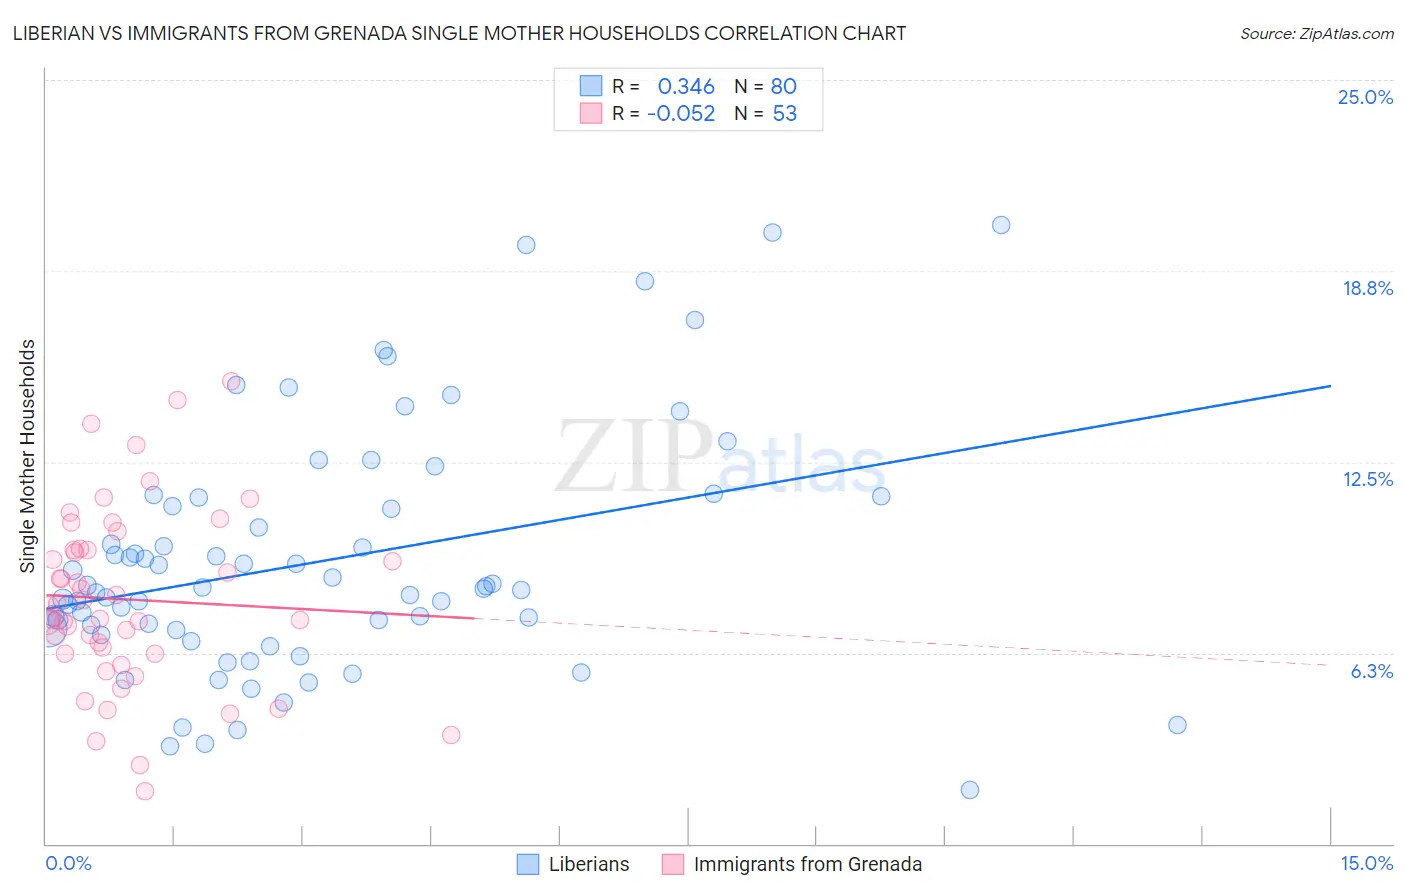
Liberian vs Immigrants from Grenada Single Mother Households Correlation Chart
The statistical analysis conducted on geographies consisting of 118,018,313 people shows a mild positive correlation between the proportion of Liberians and percentage of single mother households in the United States with a correlation coefficient (R) of 0.346 and weighted average of 8.6%. Similarly, the statistical analysis conducted on geographies consisting of 67,162,993 people shows a slight negative correlation between the proportion of Immigrants from Grenada and percentage of single mother households in the United States with a correlation coefficient (R) of -0.052 and weighted average of 8.2%, a difference of 6.0%.
Single Mother Households Correlation Summary
| Measurement | Liberian | Immigrants from Grenada |
| Minimum | 1.7% | 1.7% |
| Maximum | 20.2% | 15.1% |
| Range | 18.5% | 13.4% |
| Mean | 9.3% | 8.0% |
| Median | 8.4% | 7.8% |
| Interquartile 25% (IQ1) | 7.0% | 6.2% |
| Interquartile 75% (IQ3) | 11.2% | 9.6% |
| Interquartile Range (IQR) | 4.2% | 3.4% |
| Standard Deviation (Sample) | 4.0% | 2.9% |
| Standard Deviation (Population) | 3.9% | 2.9% |
Demographics Similar to Liberians and Immigrants from Grenada by Single Mother Households
In terms of single mother households, the demographic groups most similar to Liberians are U.S. Virgin Islander (8.6%, a difference of 0.33%), Inupiat (8.5%, a difference of 1.8%), Sioux (8.5%, a difference of 1.8%), Hopi (8.5%, a difference of 2.0%), and Yakama (8.4%, a difference of 2.7%). Similarly, the demographic groups most similar to Immigrants from Grenada are Immigrants from Mexico (8.2%, a difference of 0.12%), Immigrants from Western Africa (8.2%, a difference of 0.15%), African (8.2%, a difference of 0.29%), Immigrants from Honduras (8.2%, a difference of 0.43%), and Senegalese (8.2%, a difference of 1.0%).
| Demographics | Rating | Rank | Single Mother Households |
| Immigrants | Grenada | 0.0 /100 | #313 | Tragic 8.2% |
| Immigrants | Mexico | 0.0 /100 | #314 | Tragic 8.2% |
| Immigrants | Western Africa | 0.0 /100 | #315 | Tragic 8.2% |
| Africans | 0.0 /100 | #316 | Tragic 8.2% |
| Immigrants | Honduras | 0.0 /100 | #317 | Tragic 8.2% |
| Senegalese | 0.0 /100 | #318 | Tragic 8.2% |
| Jamaicans | 0.0 /100 | #319 | Tragic 8.2% |
| Bahamians | 0.0 /100 | #320 | Tragic 8.3% |
| Immigrants | Senegal | 0.0 /100 | #321 | Tragic 8.3% |
| Pima | 0.0 /100 | #322 | Tragic 8.3% |
| Haitians | 0.0 /100 | #323 | Tragic 8.3% |
| Immigrants | Jamaica | 0.0 /100 | #324 | Tragic 8.4% |
| Immigrants | Caribbean | 0.0 /100 | #325 | Tragic 8.4% |
| British West Indians | 0.0 /100 | #326 | Tragic 8.4% |
| Immigrants | Haiti | 0.0 /100 | #327 | Tragic 8.4% |
| Yakama | 0.0 /100 | #328 | Tragic 8.4% |
| Hopi | 0.0 /100 | #329 | Tragic 8.5% |
| Inupiat | 0.0 /100 | #330 | Tragic 8.5% |
| Sioux | 0.0 /100 | #331 | Tragic 8.5% |
| U.S. Virgin Islanders | 0.0 /100 | #332 | Tragic 8.6% |
| Liberians | 0.0 /100 | #333 | Tragic 8.6% |