Paiute vs Yuman Single Mother Households
COMPARE
Paiute
Yuman
Single Mother Households
Single Mother Households Comparison
Paiute
Yuman
7.0%
SINGLE MOTHER HOUSEHOLDS
2.4/ 100
METRIC RATING
226th/ 347
METRIC RANK
9.6%
SINGLE MOTHER HOUSEHOLDS
0.0/ 100
METRIC RATING
346th/ 347
METRIC RANK
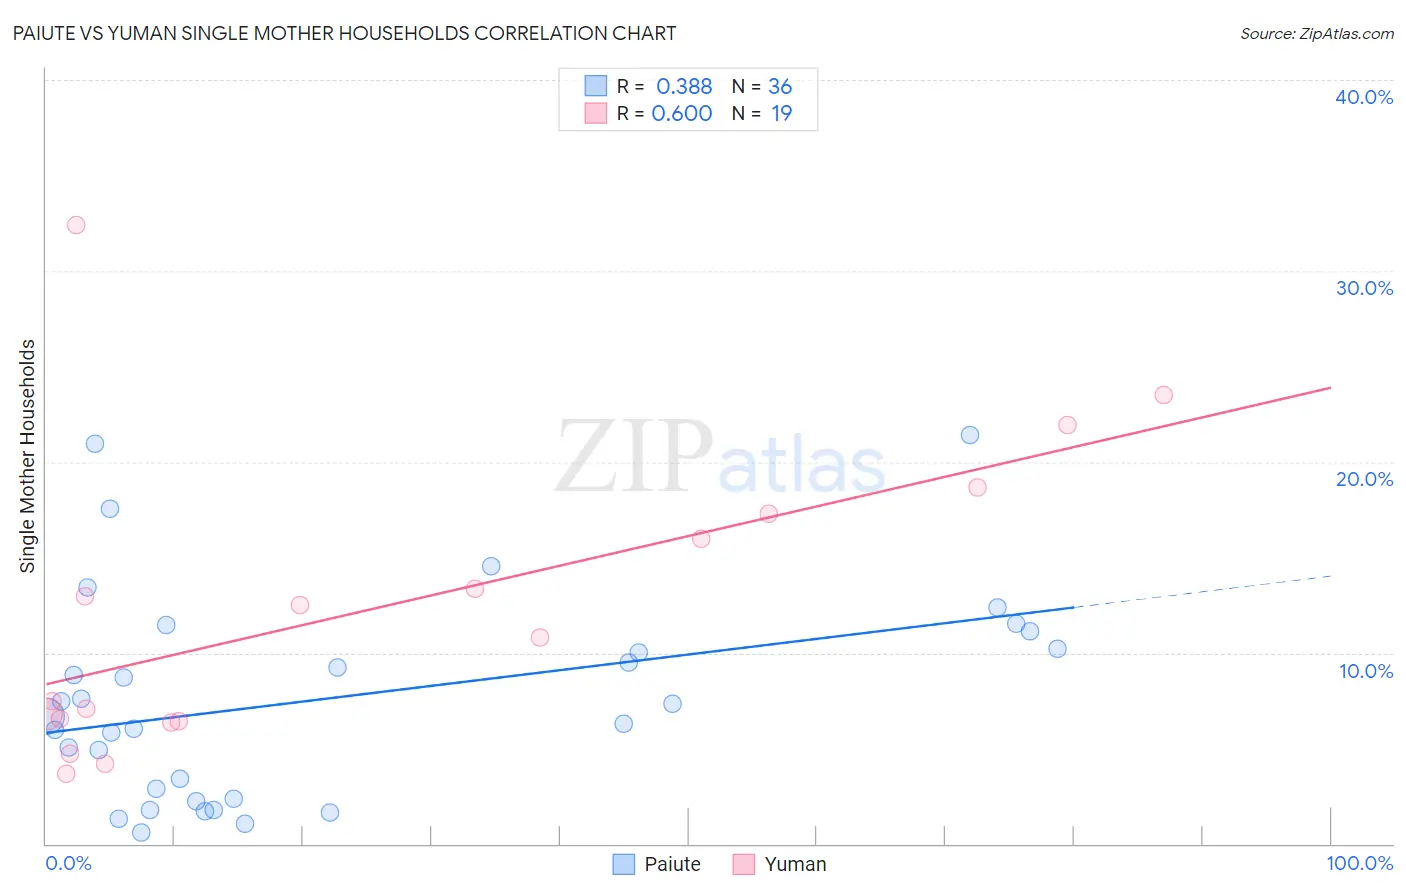
Paiute vs Yuman Single Mother Households Correlation Chart
The statistical analysis conducted on geographies consisting of 58,356,000 people shows a mild positive correlation between the proportion of Paiute and percentage of single mother households in the United States with a correlation coefficient (R) of 0.388 and weighted average of 7.0%. Similarly, the statistical analysis conducted on geographies consisting of 40,651,175 people shows a significant positive correlation between the proportion of Yuman and percentage of single mother households in the United States with a correlation coefficient (R) of 0.600 and weighted average of 9.6%, a difference of 38.6%.
Single Mother Households Correlation Summary
| Measurement | Paiute | Yuman |
| Minimum | 0.59% | 3.7% |
| Maximum | 21.4% | 32.4% |
| Range | 20.8% | 28.7% |
| Mean | 7.6% | 12.2% |
| Median | 7.0% | 10.8% |
| Interquartile 25% (IQ1) | 2.6% | 6.4% |
| Interquartile 75% (IQ3) | 10.7% | 17.3% |
| Interquartile Range (IQR) | 8.0% | 10.8% |
| Standard Deviation (Sample) | 5.4% | 7.8% |
| Standard Deviation (Population) | 5.3% | 7.6% |
Similar Demographics by Single Mother Households
Demographics Similar to Paiute by Single Mother Households
In terms of single mother households, the demographic groups most similar to Paiute are Kenyan (7.0%, a difference of 0.14%), Iroquois (7.0%, a difference of 0.17%), Immigrants from Kenya (7.0%, a difference of 0.34%), Sudanese (6.9%, a difference of 0.68%), and Immigrants from Sudan (6.9%, a difference of 0.96%).
| Demographics | Rating | Rank | Single Mother Households |
| Immigrants | Immigrants | 4.3 /100 | #219 | Tragic 6.8% |
| Immigrants | Thailand | 4.0 /100 | #220 | Tragic 6.9% |
| French American Indians | 3.7 /100 | #221 | Tragic 6.9% |
| Immigrants | Bangladesh | 3.7 /100 | #222 | Tragic 6.9% |
| Immigrants | Micronesia | 3.6 /100 | #223 | Tragic 6.9% |
| Immigrants | Sudan | 3.5 /100 | #224 | Tragic 6.9% |
| Sudanese | 3.1 /100 | #225 | Tragic 6.9% |
| Paiute | 2.4 /100 | #226 | Tragic 7.0% |
| Kenyans | 2.3 /100 | #227 | Tragic 7.0% |
| Iroquois | 2.2 /100 | #228 | Tragic 7.0% |
| Immigrants | Kenya | 2.1 /100 | #229 | Tragic 7.0% |
| Creek | 1.6 /100 | #230 | Tragic 7.0% |
| Spanish Americans | 1.6 /100 | #231 | Tragic 7.0% |
| Comanche | 1.5 /100 | #232 | Tragic 7.0% |
| Choctaw | 1.4 /100 | #233 | Tragic 7.0% |
Demographics Similar to Yuman by Single Mother Households
In terms of single mother households, the demographic groups most similar to Yuman are Immigrants from Cabo Verde (9.6%, a difference of 0.59%), Immigrants from Dominican Republic (9.5%, a difference of 1.4%), Yup'ik (10.0%, a difference of 3.8%), Dominican (9.2%, a difference of 4.9%), and Menominee (9.2%, a difference of 5.2%).
| Demographics | Rating | Rank | Single Mother Households |
| Liberians | 0.0 /100 | #333 | Tragic 8.6% |
| Immigrants | Liberia | 0.0 /100 | #334 | Tragic 8.7% |
| Immigrants | Dominica | 0.0 /100 | #335 | Tragic 8.7% |
| Puerto Ricans | 0.0 /100 | #336 | Tragic 8.7% |
| Navajo | 0.0 /100 | #337 | Tragic 8.8% |
| Cape Verdeans | 0.0 /100 | #338 | Tragic 8.9% |
| Blacks/African Americans | 0.0 /100 | #339 | Tragic 9.0% |
| Lumbee | 0.0 /100 | #340 | Tragic 9.1% |
| Tohono O'odham | 0.0 /100 | #341 | Tragic 9.1% |
| Menominee | 0.0 /100 | #342 | Tragic 9.2% |
| Dominicans | 0.0 /100 | #343 | Tragic 9.2% |
| Immigrants | Dominican Republic | 0.0 /100 | #344 | Tragic 9.5% |
| Immigrants | Cabo Verde | 0.0 /100 | #345 | Tragic 9.6% |
| Yuman | 0.0 /100 | #346 | Tragic 9.6% |
| Yup'ik | 0.0 /100 | #347 | Tragic 10.0% |