American vs Immigrants from Grenada Single Mother Households
COMPARE
American
Immigrants from Grenada
Single Mother Households
Single Mother Households Comparison
Americans
Immigrants from Grenada
6.6%
SINGLE MOTHER HOUSEHOLDS
19.0/ 100
METRIC RATING
192nd/ 347
METRIC RANK
8.2%
SINGLE MOTHER HOUSEHOLDS
0.0/ 100
METRIC RATING
313th/ 347
METRIC RANK
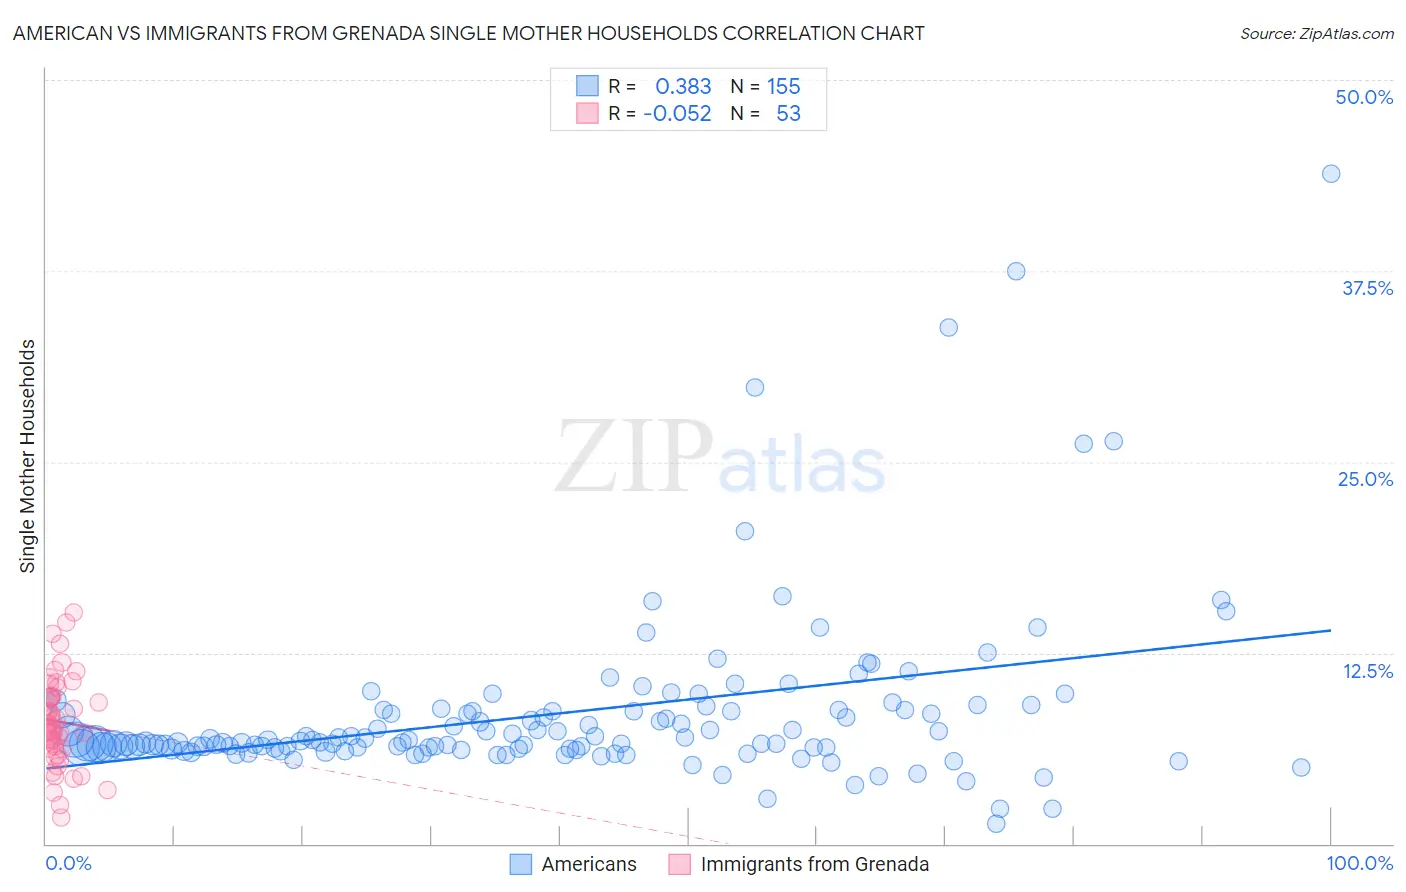
American vs Immigrants from Grenada Single Mother Households Correlation Chart
The statistical analysis conducted on geographies consisting of 575,485,944 people shows a mild positive correlation between the proportion of Americans and percentage of single mother households in the United States with a correlation coefficient (R) of 0.383 and weighted average of 6.6%. Similarly, the statistical analysis conducted on geographies consisting of 67,162,993 people shows a slight negative correlation between the proportion of Immigrants from Grenada and percentage of single mother households in the United States with a correlation coefficient (R) of -0.052 and weighted average of 8.2%, a difference of 24.2%.
Single Mother Households Correlation Summary
| Measurement | American | Immigrants from Grenada |
| Minimum | 1.3% | 1.7% |
| Maximum | 43.9% | 15.1% |
| Range | 42.6% | 13.4% |
| Mean | 8.5% | 8.0% |
| Median | 6.7% | 7.8% |
| Interquartile 25% (IQ1) | 6.3% | 6.2% |
| Interquartile 75% (IQ3) | 8.7% | 9.6% |
| Interquartile Range (IQR) | 2.5% | 3.4% |
| Standard Deviation (Sample) | 5.7% | 2.9% |
| Standard Deviation (Population) | 5.7% | 2.9% |
Similar Demographics by Single Mother Households
Demographics Similar to Americans by Single Mother Households
In terms of single mother households, the demographic groups most similar to Americans are Colombian (6.6%, a difference of 0.11%), Immigrants from Uganda (6.6%, a difference of 0.12%), South American (6.6%, a difference of 0.17%), Uruguayan (6.6%, a difference of 0.17%), and Moroccan (6.6%, a difference of 0.27%).
| Demographics | Rating | Rank | Single Mother Households |
| Ugandans | 25.6 /100 | #185 | Fair 6.5% |
| Costa Ricans | 24.8 /100 | #186 | Fair 6.5% |
| Immigrants | Afghanistan | 24.7 /100 | #187 | Fair 6.5% |
| Ottawa | 23.8 /100 | #188 | Fair 6.5% |
| Delaware | 23.3 /100 | #189 | Fair 6.5% |
| Peruvians | 21.6 /100 | #190 | Fair 6.5% |
| Samoans | 21.2 /100 | #191 | Fair 6.5% |
| Americans | 19.0 /100 | #192 | Poor 6.6% |
| Colombians | 18.3 /100 | #193 | Poor 6.6% |
| Immigrants | Uganda | 18.3 /100 | #194 | Poor 6.6% |
| South Americans | 18.0 /100 | #195 | Poor 6.6% |
| Uruguayans | 18.0 /100 | #196 | Poor 6.6% |
| Moroccans | 17.4 /100 | #197 | Poor 6.6% |
| Hawaiians | 16.1 /100 | #198 | Poor 6.6% |
| Potawatomi | 15.5 /100 | #199 | Poor 6.6% |
Demographics Similar to Immigrants from Grenada by Single Mother Households
In terms of single mother households, the demographic groups most similar to Immigrants from Grenada are Immigrants from Mexico (8.2%, a difference of 0.12%), Immigrants from Western Africa (8.2%, a difference of 0.15%), Bangladeshi (8.1%, a difference of 0.16%), African (8.2%, a difference of 0.29%), and Immigrants from Honduras (8.2%, a difference of 0.43%).
| Demographics | Rating | Rank | Single Mother Households |
| Immigrants | Barbados | 0.0 /100 | #306 | Tragic 8.0% |
| Immigrants | St. Vincent and the Grenadines | 0.0 /100 | #307 | Tragic 8.0% |
| Immigrants | Central America | 0.0 /100 | #308 | Tragic 8.1% |
| Cheyenne | 0.0 /100 | #309 | Tragic 8.1% |
| Hondurans | 0.0 /100 | #310 | Tragic 8.1% |
| Immigrants | Congo | 0.0 /100 | #311 | Tragic 8.1% |
| Bangladeshis | 0.0 /100 | #312 | Tragic 8.1% |
| Immigrants | Grenada | 0.0 /100 | #313 | Tragic 8.2% |
| Immigrants | Mexico | 0.0 /100 | #314 | Tragic 8.2% |
| Immigrants | Western Africa | 0.0 /100 | #315 | Tragic 8.2% |
| Africans | 0.0 /100 | #316 | Tragic 8.2% |
| Immigrants | Honduras | 0.0 /100 | #317 | Tragic 8.2% |
| Senegalese | 0.0 /100 | #318 | Tragic 8.2% |
| Jamaicans | 0.0 /100 | #319 | Tragic 8.2% |
| Bahamians | 0.0 /100 | #320 | Tragic 8.3% |