Paiute vs Immigrants from England Divorced or Separated
COMPARE
Paiute
Immigrants from England
Divorced or Separated
Divorced or Separated Comparison
Paiute
Immigrants from England
13.6%
DIVORCED OR SEPARATED
0.0/ 100
METRIC RATING
330th/ 347
METRIC RANK
12.1%
DIVORCED OR SEPARATED
31.4/ 100
METRIC RATING
195th/ 347
METRIC RANK
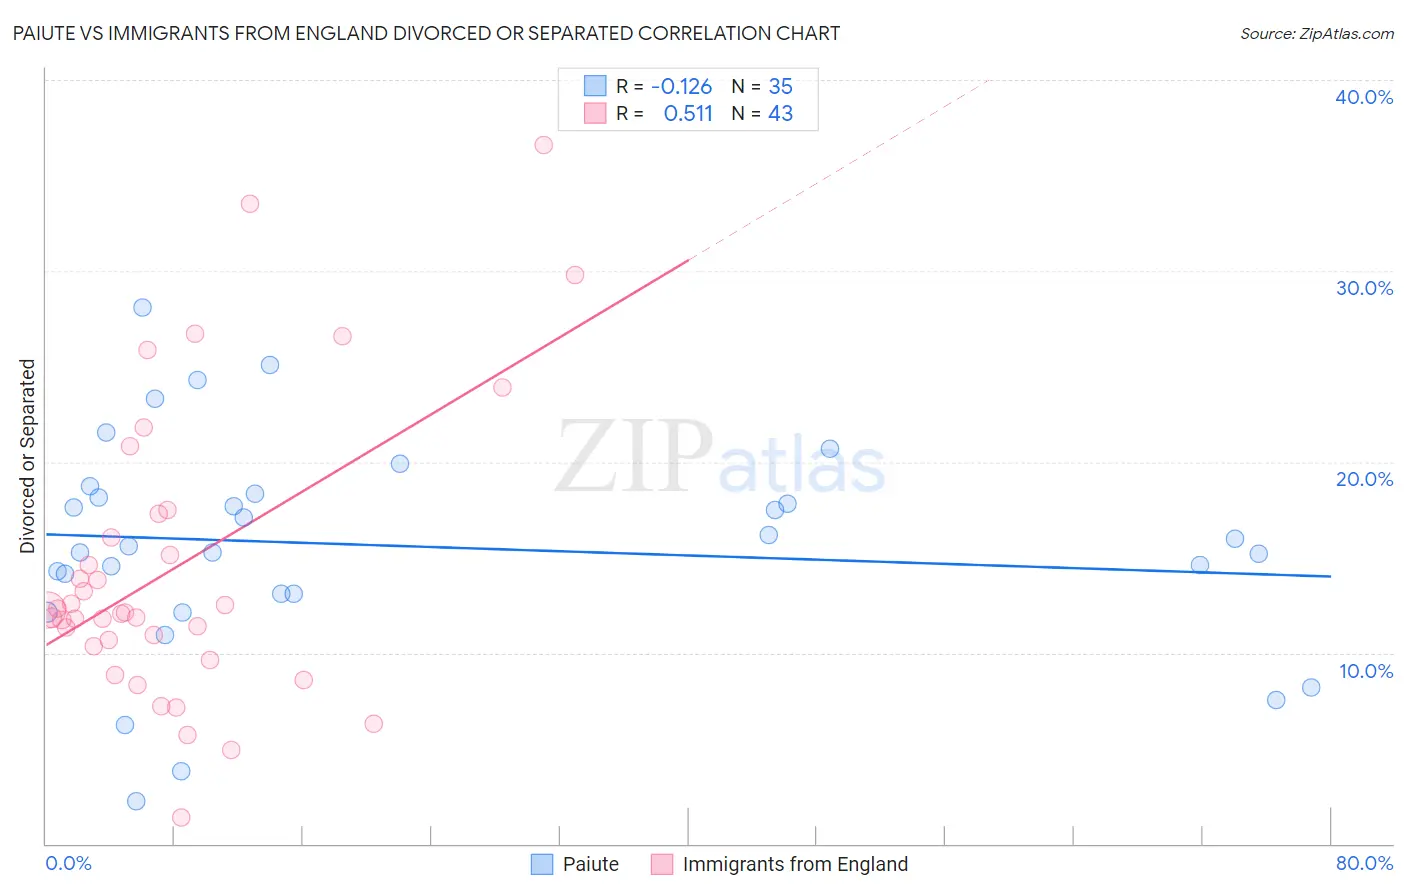
Paiute vs Immigrants from England Divorced or Separated Correlation Chart
The statistical analysis conducted on geographies consisting of 58,402,034 people shows a poor negative correlation between the proportion of Paiute and percentage of population currently divorced or separated in the United States with a correlation coefficient (R) of -0.126 and weighted average of 13.6%. Similarly, the statistical analysis conducted on geographies consisting of 391,787,172 people shows a substantial positive correlation between the proportion of Immigrants from England and percentage of population currently divorced or separated in the United States with a correlation coefficient (R) of 0.511 and weighted average of 12.1%, a difference of 12.1%.
Divorced or Separated Correlation Summary
| Measurement | Paiute | Immigrants from England |
| Minimum | 2.2% | 1.4% |
| Maximum | 28.1% | 36.6% |
| Range | 25.9% | 35.2% |
| Mean | 15.6% | 14.5% |
| Median | 15.6% | 12.1% |
| Interquartile 25% (IQ1) | 13.1% | 10.4% |
| Interquartile 75% (IQ3) | 18.3% | 17.3% |
| Interquartile Range (IQR) | 5.2% | 6.9% |
| Standard Deviation (Sample) | 5.7% | 7.7% |
| Standard Deviation (Population) | 5.6% | 7.6% |
Similar Demographics by Divorced or Separated
Demographics Similar to Paiute by Divorced or Separated
In terms of divorced or separated, the demographic groups most similar to Paiute are Houma (13.6%, a difference of 0.11%), Black/African American (13.6%, a difference of 0.13%), Immigrants from Caribbean (13.6%, a difference of 0.26%), Comanche (13.5%, a difference of 0.64%), and Cherokee (13.7%, a difference of 0.89%).
| Demographics | Rating | Rank | Divorced or Separated |
| U.S. Virgin Islanders | 0.0 /100 | #323 | Tragic 13.4% |
| Osage | 0.0 /100 | #324 | Tragic 13.4% |
| Potawatomi | 0.0 /100 | #325 | Tragic 13.5% |
| Immigrants | Congo | 0.0 /100 | #326 | Tragic 13.5% |
| Comanche | 0.0 /100 | #327 | Tragic 13.5% |
| Immigrants | Caribbean | 0.0 /100 | #328 | Tragic 13.6% |
| Houma | 0.0 /100 | #329 | Tragic 13.6% |
| Paiute | 0.0 /100 | #330 | Tragic 13.6% |
| Blacks/African Americans | 0.0 /100 | #331 | Tragic 13.6% |
| Cherokee | 0.0 /100 | #332 | Tragic 13.7% |
| Puerto Ricans | 0.0 /100 | #333 | Tragic 13.9% |
| Immigrants | Bahamas | 0.0 /100 | #334 | Tragic 13.9% |
| Dutch West Indians | 0.0 /100 | #335 | Tragic 14.0% |
| Shoshone | 0.0 /100 | #336 | Tragic 14.0% |
| Crow | 0.0 /100 | #337 | Tragic 14.1% |
Demographics Similar to Immigrants from England by Divorced or Separated
In terms of divorced or separated, the demographic groups most similar to Immigrants from England are Immigrants from Eritrea (12.1%, a difference of 0.020%), Immigrants from Thailand (12.1%, a difference of 0.040%), Immigrants from Burma/Myanmar (12.1%, a difference of 0.040%), Immigrants from Africa (12.1%, a difference of 0.040%), and Nigerian (12.1%, a difference of 0.050%).
| Demographics | Rating | Rank | Divorced or Separated |
| Immigrants | Belize | 37.6 /100 | #188 | Fair 12.1% |
| Sierra Leoneans | 35.5 /100 | #189 | Fair 12.1% |
| Moroccans | 34.8 /100 | #190 | Fair 12.1% |
| Swedes | 34.4 /100 | #191 | Fair 12.1% |
| Norwegians | 33.2 /100 | #192 | Fair 12.1% |
| Immigrants | Thailand | 32.5 /100 | #193 | Fair 12.1% |
| Immigrants | Eritrea | 31.9 /100 | #194 | Fair 12.1% |
| Immigrants | England | 31.4 /100 | #195 | Fair 12.1% |
| Immigrants | Burma/Myanmar | 30.4 /100 | #196 | Fair 12.1% |
| Immigrants | Africa | 30.3 /100 | #197 | Fair 12.1% |
| Nigerians | 30.1 /100 | #198 | Fair 12.1% |
| Central Americans | 29.4 /100 | #199 | Fair 12.1% |
| South Americans | 28.6 /100 | #200 | Fair 12.2% |
| Guatemalans | 26.9 /100 | #201 | Fair 12.2% |
| Portuguese | 23.5 /100 | #202 | Fair 12.2% |