Immigrants from Jordan vs Immigrants from England Divorced or Separated
COMPARE
Immigrants from Jordan
Immigrants from England
Divorced or Separated
Divorced or Separated Comparison
Immigrants from Jordan
Immigrants from England
11.6%
DIVORCED OR SEPARATED
98.6/ 100
METRIC RATING
98th/ 347
METRIC RANK
12.1%
DIVORCED OR SEPARATED
31.4/ 100
METRIC RATING
195th/ 347
METRIC RANK
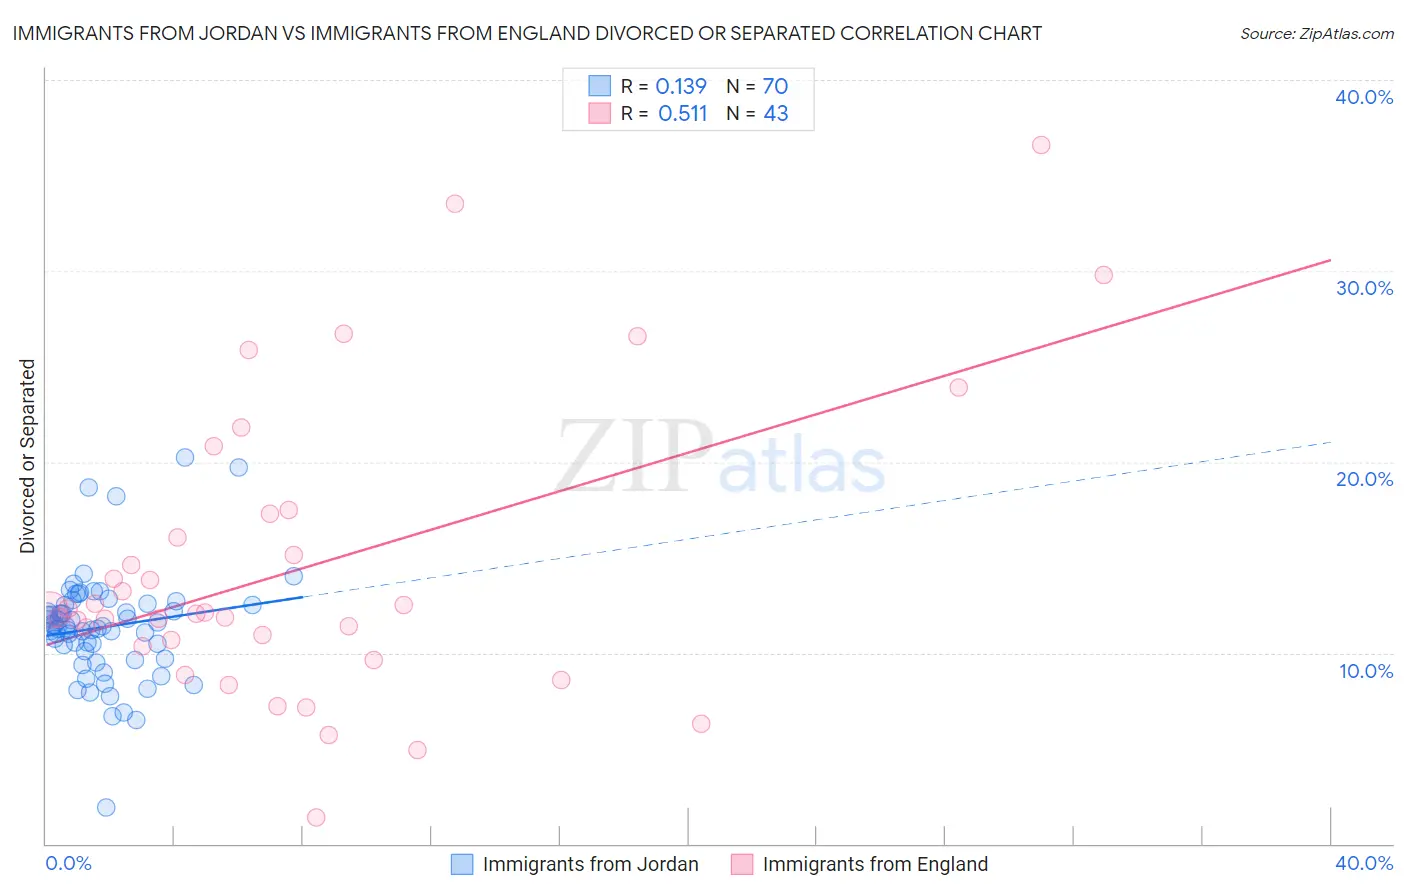
Immigrants from Jordan vs Immigrants from England Divorced or Separated Correlation Chart
The statistical analysis conducted on geographies consisting of 181,255,451 people shows a poor positive correlation between the proportion of Immigrants from Jordan and percentage of population currently divorced or separated in the United States with a correlation coefficient (R) of 0.139 and weighted average of 11.6%. Similarly, the statistical analysis conducted on geographies consisting of 391,787,172 people shows a substantial positive correlation between the proportion of Immigrants from England and percentage of population currently divorced or separated in the United States with a correlation coefficient (R) of 0.511 and weighted average of 12.1%, a difference of 4.6%.
Divorced or Separated Correlation Summary
| Measurement | Immigrants from Jordan | Immigrants from England |
| Minimum | 1.9% | 1.4% |
| Maximum | 20.2% | 36.6% |
| Range | 18.3% | 35.2% |
| Mean | 11.3% | 14.5% |
| Median | 11.4% | 12.1% |
| Interquartile 25% (IQ1) | 10.1% | 10.4% |
| Interquartile 75% (IQ3) | 12.5% | 17.3% |
| Interquartile Range (IQR) | 2.4% | 6.9% |
| Standard Deviation (Sample) | 2.9% | 7.7% |
| Standard Deviation (Population) | 2.8% | 7.6% |
Similar Demographics by Divorced or Separated
Demographics Similar to Immigrants from Jordan by Divorced or Separated
In terms of divorced or separated, the demographic groups most similar to Immigrants from Jordan are Immigrants from Sweden (11.6%, a difference of 0.020%), Latvian (11.6%, a difference of 0.040%), Immigrants from Northern Europe (11.6%, a difference of 0.050%), Immigrants from Ukraine (11.6%, a difference of 0.060%), and Immigrants from Guyana (11.6%, a difference of 0.080%).
| Demographics | Rating | Rank | Divorced or Separated |
| Spanish American Indians | 99.0 /100 | #91 | Exceptional 11.6% |
| Immigrants | Denmark | 98.9 /100 | #92 | Exceptional 11.6% |
| Arabs | 98.9 /100 | #93 | Exceptional 11.6% |
| Immigrants | Fiji | 98.9 /100 | #94 | Exceptional 11.6% |
| Immigrants | Serbia | 98.8 /100 | #95 | Exceptional 11.6% |
| Immigrants | Ukraine | 98.7 /100 | #96 | Exceptional 11.6% |
| Latvians | 98.7 /100 | #97 | Exceptional 11.6% |
| Immigrants | Jordan | 98.6 /100 | #98 | Exceptional 11.6% |
| Immigrants | Sweden | 98.6 /100 | #99 | Exceptional 11.6% |
| Immigrants | Northern Europe | 98.6 /100 | #100 | Exceptional 11.6% |
| Immigrants | Guyana | 98.5 /100 | #101 | Exceptional 11.6% |
| Immigrants | Croatia | 98.3 /100 | #102 | Exceptional 11.6% |
| Maltese | 98.2 /100 | #103 | Exceptional 11.6% |
| Salvadorans | 98.2 /100 | #104 | Exceptional 11.6% |
| Immigrants | El Salvador | 97.9 /100 | #105 | Exceptional 11.7% |
Demographics Similar to Immigrants from England by Divorced or Separated
In terms of divorced or separated, the demographic groups most similar to Immigrants from England are Immigrants from Eritrea (12.1%, a difference of 0.020%), Immigrants from Thailand (12.1%, a difference of 0.040%), Immigrants from Burma/Myanmar (12.1%, a difference of 0.040%), Immigrants from Africa (12.1%, a difference of 0.040%), and Nigerian (12.1%, a difference of 0.050%).
| Demographics | Rating | Rank | Divorced or Separated |
| Immigrants | Belize | 37.6 /100 | #188 | Fair 12.1% |
| Sierra Leoneans | 35.5 /100 | #189 | Fair 12.1% |
| Moroccans | 34.8 /100 | #190 | Fair 12.1% |
| Swedes | 34.4 /100 | #191 | Fair 12.1% |
| Norwegians | 33.2 /100 | #192 | Fair 12.1% |
| Immigrants | Thailand | 32.5 /100 | #193 | Fair 12.1% |
| Immigrants | Eritrea | 31.9 /100 | #194 | Fair 12.1% |
| Immigrants | England | 31.4 /100 | #195 | Fair 12.1% |
| Immigrants | Burma/Myanmar | 30.4 /100 | #196 | Fair 12.1% |
| Immigrants | Africa | 30.3 /100 | #197 | Fair 12.1% |
| Nigerians | 30.1 /100 | #198 | Fair 12.1% |
| Central Americans | 29.4 /100 | #199 | Fair 12.1% |
| South Americans | 28.6 /100 | #200 | Fair 12.2% |
| Guatemalans | 26.9 /100 | #201 | Fair 12.2% |
| Portuguese | 23.5 /100 | #202 | Fair 12.2% |