Paiute vs Albanian Divorced or Separated
COMPARE
Paiute
Albanian
Divorced or Separated
Divorced or Separated Comparison
Paiute
Albanians
13.6%
DIVORCED OR SEPARATED
0.0/ 100
METRIC RATING
330th/ 347
METRIC RANK
11.5%
DIVORCED OR SEPARATED
99.6/ 100
METRIC RATING
76th/ 347
METRIC RANK
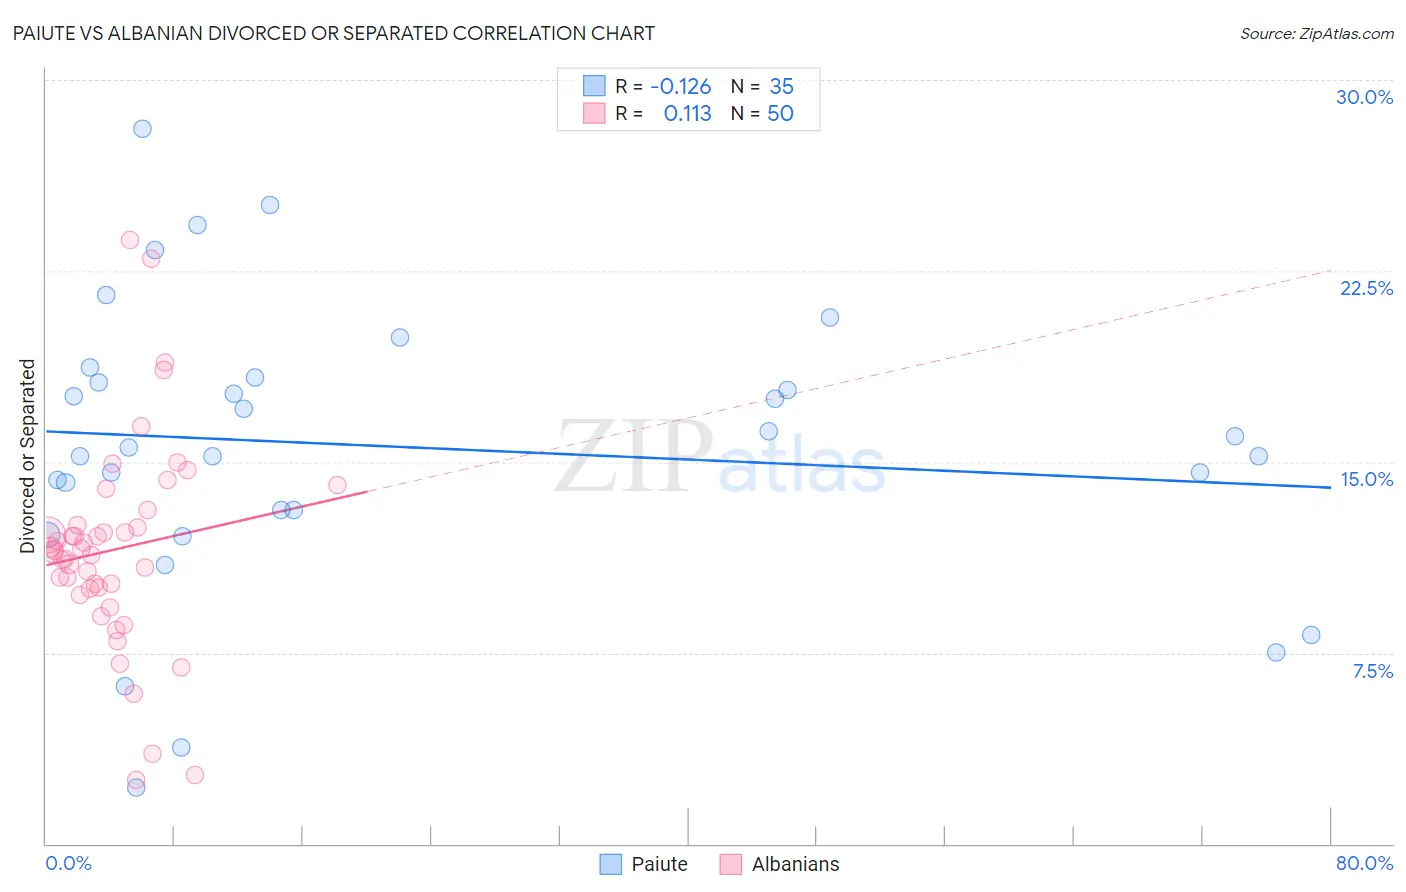
Paiute vs Albanian Divorced or Separated Correlation Chart
The statistical analysis conducted on geographies consisting of 58,402,034 people shows a poor negative correlation between the proportion of Paiute and percentage of population currently divorced or separated in the United States with a correlation coefficient (R) of -0.126 and weighted average of 13.6%. Similarly, the statistical analysis conducted on geographies consisting of 193,199,268 people shows a poor positive correlation between the proportion of Albanians and percentage of population currently divorced or separated in the United States with a correlation coefficient (R) of 0.113 and weighted average of 11.5%, a difference of 18.5%.
Divorced or Separated Correlation Summary
| Measurement | Paiute | Albanian |
| Minimum | 2.2% | 2.5% |
| Maximum | 28.1% | 23.7% |
| Range | 25.9% | 21.2% |
| Mean | 15.6% | 11.6% |
| Median | 15.6% | 11.5% |
| Interquartile 25% (IQ1) | 13.1% | 10.0% |
| Interquartile 75% (IQ3) | 18.3% | 12.5% |
| Interquartile Range (IQR) | 5.2% | 2.5% |
| Standard Deviation (Sample) | 5.7% | 4.1% |
| Standard Deviation (Population) | 5.6% | 4.1% |
Similar Demographics by Divorced or Separated
Demographics Similar to Paiute by Divorced or Separated
In terms of divorced or separated, the demographic groups most similar to Paiute are Houma (13.6%, a difference of 0.11%), Black/African American (13.6%, a difference of 0.13%), Immigrants from Caribbean (13.6%, a difference of 0.26%), Comanche (13.5%, a difference of 0.64%), and Cherokee (13.7%, a difference of 0.89%).
| Demographics | Rating | Rank | Divorced or Separated |
| U.S. Virgin Islanders | 0.0 /100 | #323 | Tragic 13.4% |
| Osage | 0.0 /100 | #324 | Tragic 13.4% |
| Potawatomi | 0.0 /100 | #325 | Tragic 13.5% |
| Immigrants | Congo | 0.0 /100 | #326 | Tragic 13.5% |
| Comanche | 0.0 /100 | #327 | Tragic 13.5% |
| Immigrants | Caribbean | 0.0 /100 | #328 | Tragic 13.6% |
| Houma | 0.0 /100 | #329 | Tragic 13.6% |
| Paiute | 0.0 /100 | #330 | Tragic 13.6% |
| Blacks/African Americans | 0.0 /100 | #331 | Tragic 13.6% |
| Cherokee | 0.0 /100 | #332 | Tragic 13.7% |
| Puerto Ricans | 0.0 /100 | #333 | Tragic 13.9% |
| Immigrants | Bahamas | 0.0 /100 | #334 | Tragic 13.9% |
| Dutch West Indians | 0.0 /100 | #335 | Tragic 14.0% |
| Shoshone | 0.0 /100 | #336 | Tragic 14.0% |
| Crow | 0.0 /100 | #337 | Tragic 14.1% |
Demographics Similar to Albanians by Divorced or Separated
In terms of divorced or separated, the demographic groups most similar to Albanians are Immigrants from Northern Africa (11.5%, a difference of 0.020%), Taiwanese (11.5%, a difference of 0.10%), Immigrants from Italy (11.5%, a difference of 0.11%), Jordanian (11.5%, a difference of 0.16%), and Immigrants from North Macedonia (11.5%, a difference of 0.16%).
| Demographics | Rating | Rank | Divorced or Separated |
| Immigrants | Belgium | 99.7 /100 | #69 | Exceptional 11.5% |
| Immigrants | Eastern Europe | 99.7 /100 | #70 | Exceptional 11.5% |
| Paraguayans | 99.7 /100 | #71 | Exceptional 11.5% |
| Jordanians | 99.6 /100 | #72 | Exceptional 11.5% |
| Immigrants | North Macedonia | 99.6 /100 | #73 | Exceptional 11.5% |
| Taiwanese | 99.6 /100 | #74 | Exceptional 11.5% |
| Immigrants | Northern Africa | 99.6 /100 | #75 | Exceptional 11.5% |
| Albanians | 99.6 /100 | #76 | Exceptional 11.5% |
| Immigrants | Italy | 99.5 /100 | #77 | Exceptional 11.5% |
| Afghans | 99.4 /100 | #78 | Exceptional 11.5% |
| Guyanese | 99.4 /100 | #79 | Exceptional 11.5% |
| Immigrants | Switzerland | 99.4 /100 | #80 | Exceptional 11.5% |
| Russians | 99.4 /100 | #81 | Exceptional 11.5% |
| Immigrants | Romania | 99.3 /100 | #82 | Exceptional 11.5% |
| Immigrants | Bulgaria | 99.3 /100 | #83 | Exceptional 11.5% |