Paiute vs Immigrants from Ukraine Divorced or Separated
COMPARE
Paiute
Immigrants from Ukraine
Divorced or Separated
Divorced or Separated Comparison
Paiute
Immigrants from Ukraine
13.6%
DIVORCED OR SEPARATED
0.0/ 100
METRIC RATING
330th/ 347
METRIC RANK
11.6%
DIVORCED OR SEPARATED
98.7/ 100
METRIC RATING
96th/ 347
METRIC RANK
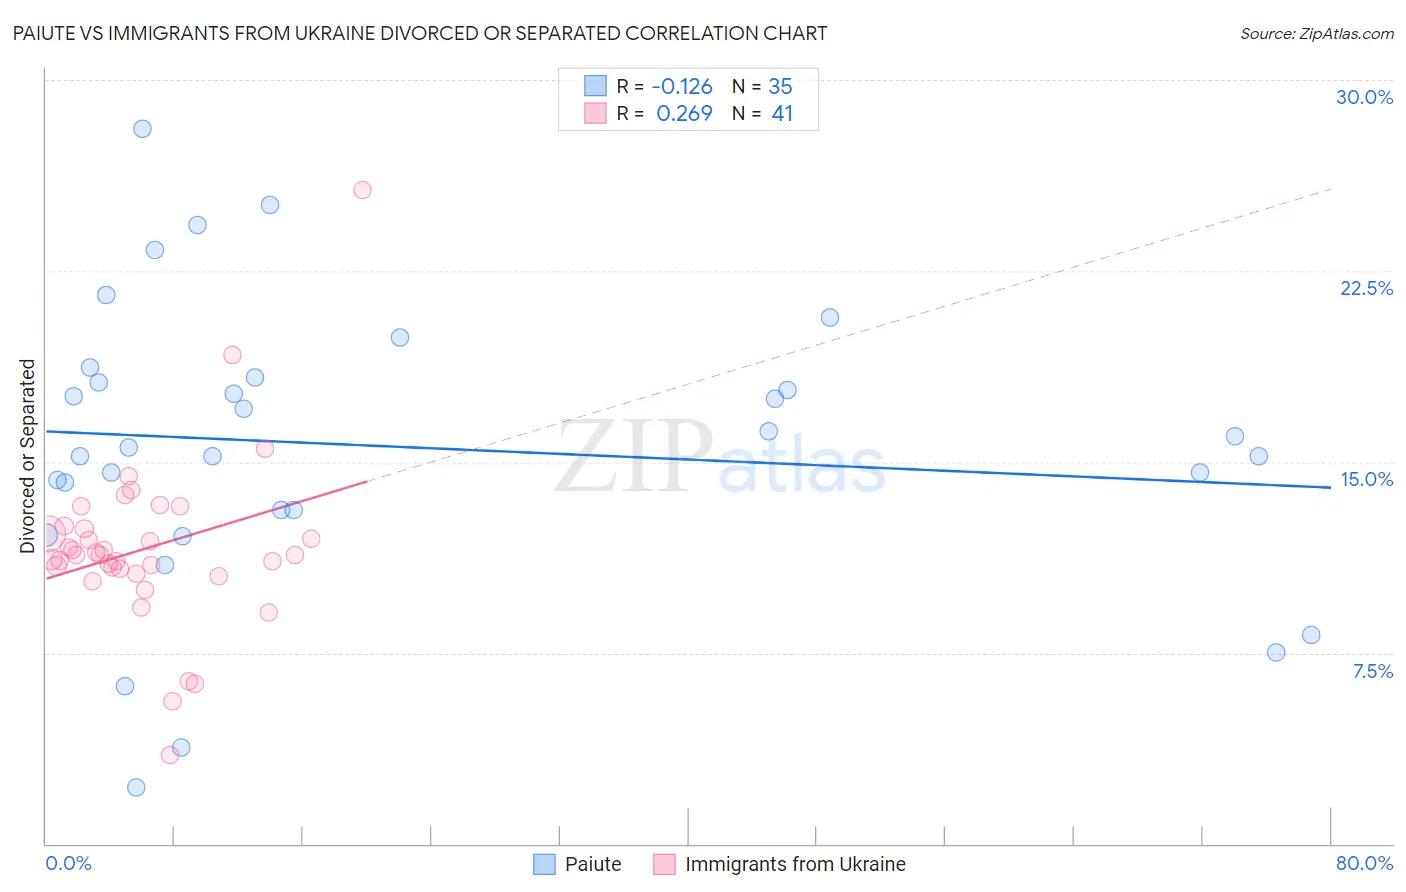
Paiute vs Immigrants from Ukraine Divorced or Separated Correlation Chart
The statistical analysis conducted on geographies consisting of 58,402,034 people shows a poor negative correlation between the proportion of Paiute and percentage of population currently divorced or separated in the United States with a correlation coefficient (R) of -0.126 and weighted average of 13.6%. Similarly, the statistical analysis conducted on geographies consisting of 289,638,825 people shows a weak positive correlation between the proportion of Immigrants from Ukraine and percentage of population currently divorced or separated in the United States with a correlation coefficient (R) of 0.269 and weighted average of 11.6%, a difference of 17.3%.
Divorced or Separated Correlation Summary
| Measurement | Paiute | Immigrants from Ukraine |
| Minimum | 2.2% | 3.5% |
| Maximum | 28.1% | 25.7% |
| Range | 25.9% | 22.2% |
| Mean | 15.6% | 11.6% |
| Median | 15.6% | 11.3% |
| Interquartile 25% (IQ1) | 13.1% | 10.7% |
| Interquartile 75% (IQ3) | 18.3% | 12.4% |
| Interquartile Range (IQR) | 5.2% | 1.7% |
| Standard Deviation (Sample) | 5.7% | 3.5% |
| Standard Deviation (Population) | 5.6% | 3.4% |
Similar Demographics by Divorced or Separated
Demographics Similar to Paiute by Divorced or Separated
In terms of divorced or separated, the demographic groups most similar to Paiute are Houma (13.6%, a difference of 0.11%), Black/African American (13.6%, a difference of 0.13%), Immigrants from Caribbean (13.6%, a difference of 0.26%), Comanche (13.5%, a difference of 0.64%), and Cherokee (13.7%, a difference of 0.89%).
| Demographics | Rating | Rank | Divorced or Separated |
| U.S. Virgin Islanders | 0.0 /100 | #323 | Tragic 13.4% |
| Osage | 0.0 /100 | #324 | Tragic 13.4% |
| Potawatomi | 0.0 /100 | #325 | Tragic 13.5% |
| Immigrants | Congo | 0.0 /100 | #326 | Tragic 13.5% |
| Comanche | 0.0 /100 | #327 | Tragic 13.5% |
| Immigrants | Caribbean | 0.0 /100 | #328 | Tragic 13.6% |
| Houma | 0.0 /100 | #329 | Tragic 13.6% |
| Paiute | 0.0 /100 | #330 | Tragic 13.6% |
| Blacks/African Americans | 0.0 /100 | #331 | Tragic 13.6% |
| Cherokee | 0.0 /100 | #332 | Tragic 13.7% |
| Puerto Ricans | 0.0 /100 | #333 | Tragic 13.9% |
| Immigrants | Bahamas | 0.0 /100 | #334 | Tragic 13.9% |
| Dutch West Indians | 0.0 /100 | #335 | Tragic 14.0% |
| Shoshone | 0.0 /100 | #336 | Tragic 14.0% |
| Crow | 0.0 /100 | #337 | Tragic 14.1% |
Demographics Similar to Immigrants from Ukraine by Divorced or Separated
In terms of divorced or separated, the demographic groups most similar to Immigrants from Ukraine are Immigrants from Serbia (11.6%, a difference of 0.020%), Latvian (11.6%, a difference of 0.030%), Immigrants from Jordan (11.6%, a difference of 0.060%), Immigrants from Sweden (11.6%, a difference of 0.080%), and Immigrants from Northern Europe (11.6%, a difference of 0.11%).
| Demographics | Rating | Rank | Divorced or Separated |
| Immigrants | Southern Europe | 99.1 /100 | #89 | Exceptional 11.6% |
| Zimbabweans | 99.0 /100 | #90 | Exceptional 11.6% |
| Spanish American Indians | 99.0 /100 | #91 | Exceptional 11.6% |
| Immigrants | Denmark | 98.9 /100 | #92 | Exceptional 11.6% |
| Arabs | 98.9 /100 | #93 | Exceptional 11.6% |
| Immigrants | Fiji | 98.9 /100 | #94 | Exceptional 11.6% |
| Immigrants | Serbia | 98.8 /100 | #95 | Exceptional 11.6% |
| Immigrants | Ukraine | 98.7 /100 | #96 | Exceptional 11.6% |
| Latvians | 98.7 /100 | #97 | Exceptional 11.6% |
| Immigrants | Jordan | 98.6 /100 | #98 | Exceptional 11.6% |
| Immigrants | Sweden | 98.6 /100 | #99 | Exceptional 11.6% |
| Immigrants | Northern Europe | 98.6 /100 | #100 | Exceptional 11.6% |
| Immigrants | Guyana | 98.5 /100 | #101 | Exceptional 11.6% |
| Immigrants | Croatia | 98.3 /100 | #102 | Exceptional 11.6% |
| Maltese | 98.2 /100 | #103 | Exceptional 11.6% |