Paiute vs Arapaho Divorced or Separated
COMPARE
Paiute
Arapaho
Divorced or Separated
Divorced or Separated Comparison
Paiute
Arapaho
13.6%
DIVORCED OR SEPARATED
0.0/ 100
METRIC RATING
330th/ 347
METRIC RANK
14.8%
DIVORCED OR SEPARATED
0.0/ 100
METRIC RATING
346th/ 347
METRIC RANK
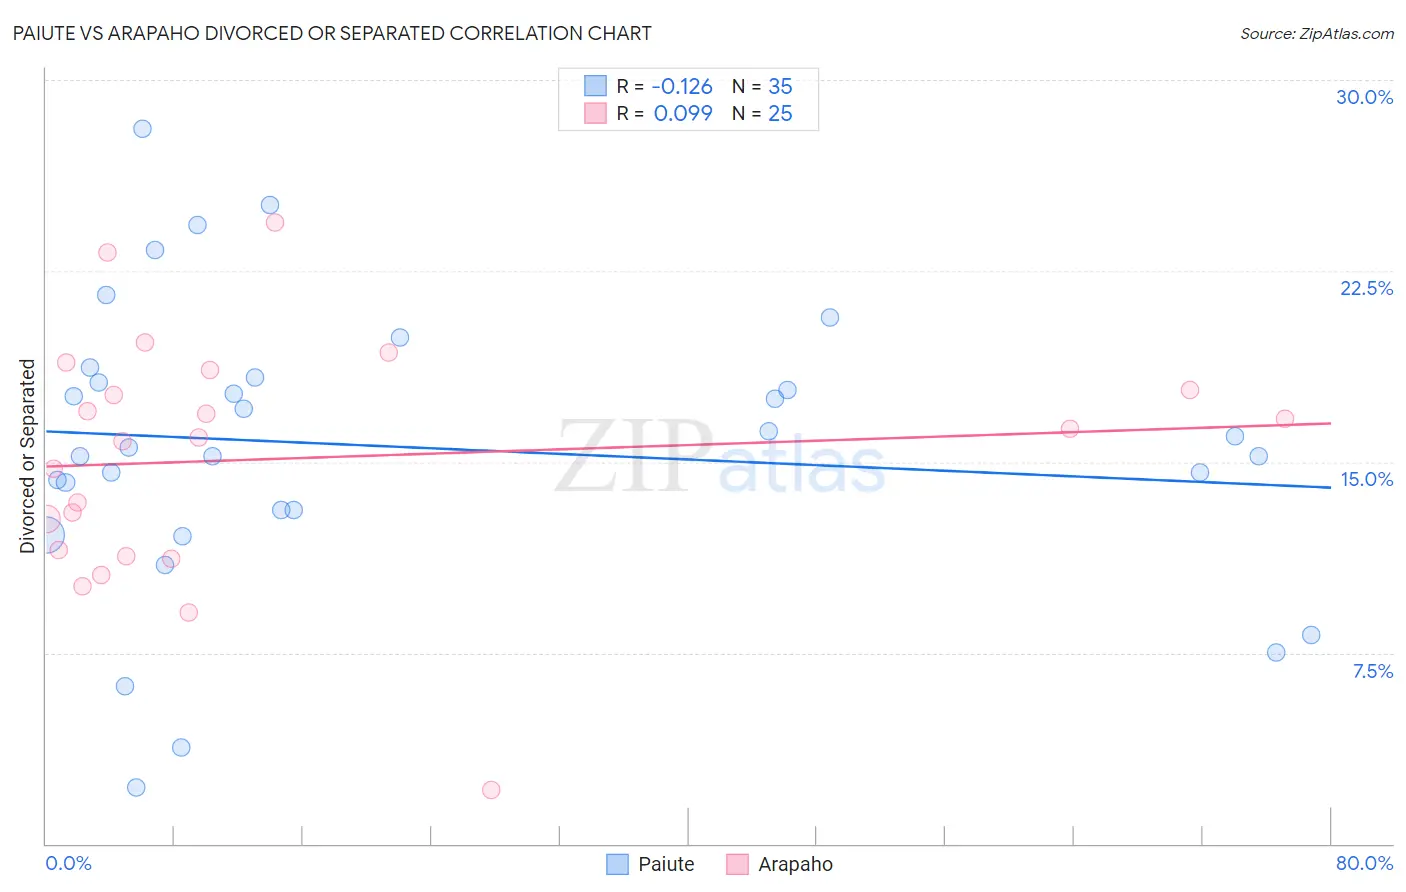
Paiute vs Arapaho Divorced or Separated Correlation Chart
The statistical analysis conducted on geographies consisting of 58,402,034 people shows a poor negative correlation between the proportion of Paiute and percentage of population currently divorced or separated in the United States with a correlation coefficient (R) of -0.126 and weighted average of 13.6%. Similarly, the statistical analysis conducted on geographies consisting of 29,779,242 people shows a slight positive correlation between the proportion of Arapaho and percentage of population currently divorced or separated in the United States with a correlation coefficient (R) of 0.099 and weighted average of 14.8%, a difference of 8.9%.
Divorced or Separated Correlation Summary
| Measurement | Paiute | Arapaho |
| Minimum | 2.2% | 2.1% |
| Maximum | 28.1% | 24.4% |
| Range | 25.9% | 22.3% |
| Mean | 15.6% | 15.1% |
| Median | 15.6% | 15.9% |
| Interquartile 25% (IQ1) | 13.1% | 11.4% |
| Interquartile 75% (IQ3) | 18.3% | 18.2% |
| Interquartile Range (IQR) | 5.2% | 6.8% |
| Standard Deviation (Sample) | 5.7% | 4.8% |
| Standard Deviation (Population) | 5.6% | 4.7% |
Demographics Similar to Paiute and Arapaho by Divorced or Separated
In terms of divorced or separated, the demographic groups most similar to Paiute are Houma (13.6%, a difference of 0.11%), Black/African American (13.6%, a difference of 0.13%), Immigrants from Caribbean (13.6%, a difference of 0.26%), Cherokee (13.7%, a difference of 0.89%), and Puerto Rican (13.9%, a difference of 1.8%). Similarly, the demographic groups most similar to Arapaho are Kiowa (14.5%, a difference of 2.1%), Cuban (14.5%, a difference of 2.2%), Immigrants from Cuba (15.2%, a difference of 2.8%), Creek (14.4%, a difference of 2.9%), and Seminole (14.3%, a difference of 3.9%).
| Demographics | Rating | Rank | Divorced or Separated |
| Immigrants | Caribbean | 0.0 /100 | #328 | Tragic 13.6% |
| Houma | 0.0 /100 | #329 | Tragic 13.6% |
| Paiute | 0.0 /100 | #330 | Tragic 13.6% |
| Blacks/African Americans | 0.0 /100 | #331 | Tragic 13.6% |
| Cherokee | 0.0 /100 | #332 | Tragic 13.7% |
| Puerto Ricans | 0.0 /100 | #333 | Tragic 13.9% |
| Immigrants | Bahamas | 0.0 /100 | #334 | Tragic 13.9% |
| Dutch West Indians | 0.0 /100 | #335 | Tragic 14.0% |
| Shoshone | 0.0 /100 | #336 | Tragic 14.0% |
| Crow | 0.0 /100 | #337 | Tragic 14.1% |
| Choctaw | 0.0 /100 | #338 | Tragic 14.1% |
| Colville | 0.0 /100 | #339 | Tragic 14.2% |
| Chickasaw | 0.0 /100 | #340 | Tragic 14.2% |
| Bahamians | 0.0 /100 | #341 | Tragic 14.2% |
| Seminole | 0.0 /100 | #342 | Tragic 14.3% |
| Creek | 0.0 /100 | #343 | Tragic 14.4% |
| Cubans | 0.0 /100 | #344 | Tragic 14.5% |
| Kiowa | 0.0 /100 | #345 | Tragic 14.5% |
| Arapaho | 0.0 /100 | #346 | Tragic 14.8% |
| Immigrants | Cuba | 0.0 /100 | #347 | Tragic 15.2% |