Paiute vs Immigrants from England Female Poverty Among 25-34 Year Olds
COMPARE
Paiute
Immigrants from England
Female Poverty Among 25-34 Year Olds
Female Poverty Among 25-34 Year Olds Comparison
Paiute
Immigrants from England
19.6%
FEMALE POVERTY AMONG 25-34 YEAR OLDS
0.0/ 100
METRIC RATING
330th/ 347
METRIC RANK
13.0%
FEMALE POVERTY AMONG 25-34 YEAR OLDS
85.5/ 100
METRIC RATING
136th/ 347
METRIC RANK
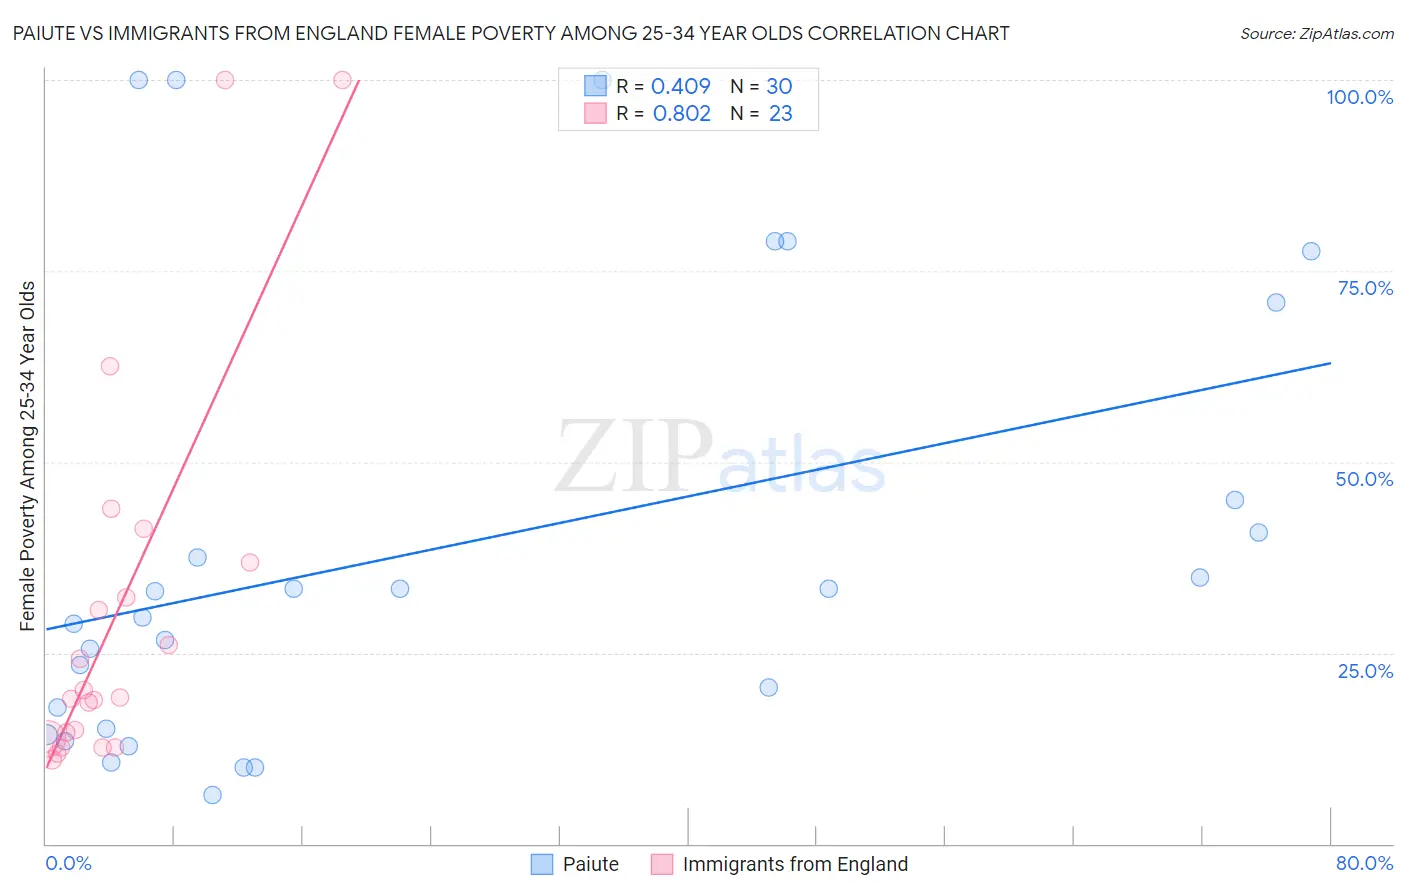
Paiute vs Immigrants from England Female Poverty Among 25-34 Year Olds Correlation Chart
The statistical analysis conducted on geographies consisting of 58,229,271 people shows a moderate positive correlation between the proportion of Paiute and poverty level among females between the ages 25 and 34 in the United States with a correlation coefficient (R) of 0.409 and weighted average of 19.6%. Similarly, the statistical analysis conducted on geographies consisting of 384,281,453 people shows a very strong positive correlation between the proportion of Immigrants from England and poverty level among females between the ages 25 and 34 in the United States with a correlation coefficient (R) of 0.802 and weighted average of 13.0%, a difference of 50.3%.
Female Poverty Among 25-34 Year Olds Correlation Summary
| Measurement | Paiute | Immigrants from England |
| Minimum | 6.4% | 11.0% |
| Maximum | 100.0% | 100.0% |
| Range | 93.6% | 89.0% |
| Mean | 38.7% | 30.3% |
| Median | 31.4% | 19.1% |
| Interquartile 25% (IQ1) | 15.1% | 13.7% |
| Interquartile 75% (IQ3) | 45.1% | 36.8% |
| Interquartile Range (IQR) | 30.0% | 23.1% |
| Standard Deviation (Sample) | 29.2% | 25.4% |
| Standard Deviation (Population) | 28.7% | 24.8% |
Similar Demographics by Female Poverty Among 25-34 Year Olds
Demographics Similar to Paiute by Female Poverty Among 25-34 Year Olds
In terms of female poverty among 25-34 year olds, the demographic groups most similar to Paiute are Kiowa (19.7%, a difference of 0.42%), Immigrants from Yemen (19.8%, a difference of 1.0%), Cajun (19.9%, a difference of 1.8%), Creek (19.2%, a difference of 2.2%), and Alaskan Athabascan (19.1%, a difference of 2.5%).
| Demographics | Rating | Rank | Female Poverty Among 25-34 Year Olds |
| Seminole | 0.0 /100 | #323 | Tragic 18.3% |
| Dutch West Indians | 0.0 /100 | #324 | Tragic 18.4% |
| Inupiat | 0.0 /100 | #325 | Tragic 18.5% |
| Blacks/African Americans | 0.0 /100 | #326 | Tragic 18.9% |
| Cheyenne | 0.0 /100 | #327 | Tragic 19.1% |
| Alaskan Athabascans | 0.0 /100 | #328 | Tragic 19.1% |
| Creek | 0.0 /100 | #329 | Tragic 19.2% |
| Paiute | 0.0 /100 | #330 | Tragic 19.6% |
| Kiowa | 0.0 /100 | #331 | Tragic 19.7% |
| Immigrants | Yemen | 0.0 /100 | #332 | Tragic 19.8% |
| Cajuns | 0.0 /100 | #333 | Tragic 19.9% |
| Apache | 0.0 /100 | #334 | Tragic 20.1% |
| Natives/Alaskans | 0.0 /100 | #335 | Tragic 20.3% |
| Pueblo | 0.0 /100 | #336 | Tragic 22.2% |
| Crow | 0.0 /100 | #337 | Tragic 22.7% |
Demographics Similar to Immigrants from England by Female Poverty Among 25-34 Year Olds
In terms of female poverty among 25-34 year olds, the demographic groups most similar to Immigrants from England are South African (13.0%, a difference of 0.020%), Afghan (13.0%, a difference of 0.040%), Immigrants from Chile (13.1%, a difference of 0.16%), Brazilian (13.1%, a difference of 0.17%), and Austrian (13.1%, a difference of 0.30%).
| Demographics | Rating | Rank | Female Poverty Among 25-34 Year Olds |
| Immigrants | North America | 89.7 /100 | #129 | Excellent 12.9% |
| Immigrants | Uzbekistan | 89.6 /100 | #130 | Excellent 12.9% |
| Pakistanis | 88.4 /100 | #131 | Excellent 13.0% |
| Immigrants | Hungary | 88.3 /100 | #132 | Excellent 13.0% |
| Serbians | 87.6 /100 | #133 | Excellent 13.0% |
| Afghans | 85.8 /100 | #134 | Excellent 13.0% |
| South Africans | 85.7 /100 | #135 | Excellent 13.0% |
| Immigrants | England | 85.5 /100 | #136 | Excellent 13.0% |
| Immigrants | Chile | 84.6 /100 | #137 | Excellent 13.1% |
| Brazilians | 84.5 /100 | #138 | Excellent 13.1% |
| Austrians | 83.7 /100 | #139 | Excellent 13.1% |
| Immigrants | Iraq | 83.6 /100 | #140 | Excellent 13.1% |
| New Zealanders | 83.4 /100 | #141 | Excellent 13.1% |
| Scandinavians | 82.3 /100 | #142 | Excellent 13.1% |
| Israelis | 81.9 /100 | #143 | Excellent 13.1% |