Immigrants from Sierra Leone vs Immigrants from England Divorced or Separated
COMPARE
Immigrants from Sierra Leone
Immigrants from England
Divorced or Separated
Divorced or Separated Comparison
Immigrants from Sierra Leone
Immigrants from England
12.1%
DIVORCED OR SEPARATED
50.0/ 100
METRIC RATING
175th/ 347
METRIC RANK
12.1%
DIVORCED OR SEPARATED
31.4/ 100
METRIC RATING
195th/ 347
METRIC RANK
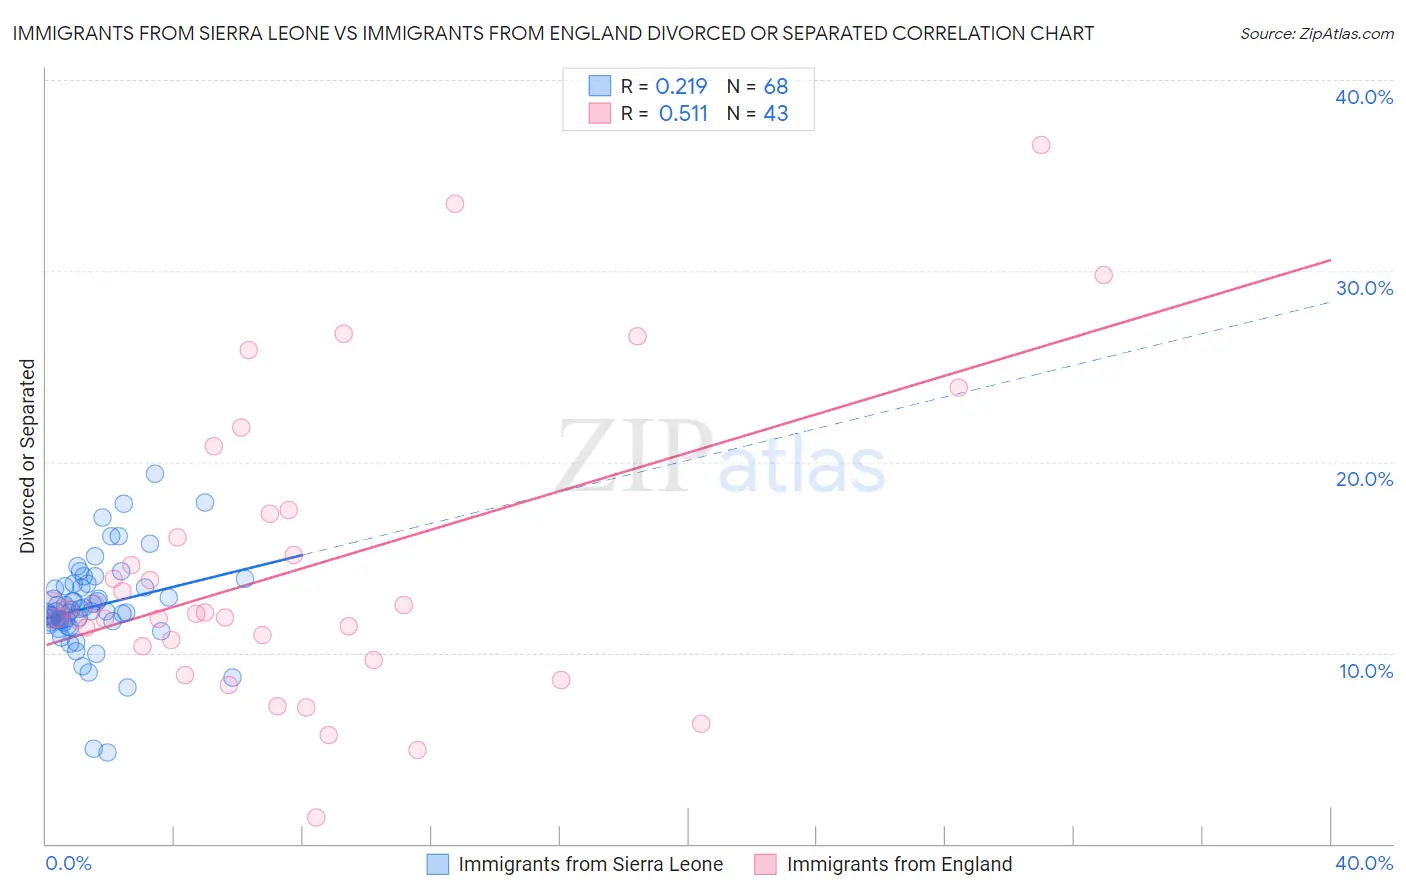
Immigrants from Sierra Leone vs Immigrants from England Divorced or Separated Correlation Chart
The statistical analysis conducted on geographies consisting of 101,651,089 people shows a weak positive correlation between the proportion of Immigrants from Sierra Leone and percentage of population currently divorced or separated in the United States with a correlation coefficient (R) of 0.219 and weighted average of 12.1%. Similarly, the statistical analysis conducted on geographies consisting of 391,787,172 people shows a substantial positive correlation between the proportion of Immigrants from England and percentage of population currently divorced or separated in the United States with a correlation coefficient (R) of 0.511 and weighted average of 12.1%, a difference of 0.68%.
Divorced or Separated Correlation Summary
| Measurement | Immigrants from Sierra Leone | Immigrants from England |
| Minimum | 4.8% | 1.4% |
| Maximum | 19.4% | 36.6% |
| Range | 14.6% | 35.2% |
| Mean | 12.4% | 14.5% |
| Median | 12.2% | 12.1% |
| Interquartile 25% (IQ1) | 11.6% | 10.4% |
| Interquartile 75% (IQ3) | 13.5% | 17.3% |
| Interquartile Range (IQR) | 1.9% | 6.9% |
| Standard Deviation (Sample) | 2.4% | 7.7% |
| Standard Deviation (Population) | 2.4% | 7.6% |
Demographics Similar to Immigrants from Sierra Leone and Immigrants from England by Divorced or Separated
In terms of divorced or separated, the demographic groups most similar to Immigrants from Sierra Leone are Pennsylvania German (12.1%, a difference of 0.040%), Brazilian (12.1%, a difference of 0.080%), Ghanaian (12.1%, a difference of 0.14%), Immigrants from Western Europe (12.1%, a difference of 0.15%), and Barbadian (12.1%, a difference of 0.17%). Similarly, the demographic groups most similar to Immigrants from England are Immigrants from Eritrea (12.1%, a difference of 0.020%), Immigrants from Thailand (12.1%, a difference of 0.040%), Norwegian (12.1%, a difference of 0.070%), Swedish (12.1%, a difference of 0.12%), and Moroccan (12.1%, a difference of 0.13%).
| Demographics | Rating | Rank | Divorced or Separated |
| Immigrants | Sierra Leone | 50.0 /100 | #175 | Average 12.1% |
| Pennsylvania Germans | 48.9 /100 | #176 | Average 12.1% |
| Brazilians | 47.7 /100 | #177 | Average 12.1% |
| Ghanaians | 45.9 /100 | #178 | Average 12.1% |
| Immigrants | Western Europe | 45.6 /100 | #179 | Average 12.1% |
| Barbadians | 45.0 /100 | #180 | Average 12.1% |
| Immigrants | Canada | 44.0 /100 | #181 | Average 12.1% |
| Immigrants | Ethiopia | 43.1 /100 | #182 | Average 12.1% |
| Immigrants | Central America | 42.9 /100 | #183 | Average 12.1% |
| Immigrants | North America | 41.1 /100 | #184 | Average 12.1% |
| Immigrants | Nigeria | 40.5 /100 | #185 | Average 12.1% |
| Immigrants | Chile | 39.0 /100 | #186 | Fair 12.1% |
| Belizeans | 37.7 /100 | #187 | Fair 12.1% |
| Immigrants | Belize | 37.6 /100 | #188 | Fair 12.1% |
| Sierra Leoneans | 35.5 /100 | #189 | Fair 12.1% |
| Moroccans | 34.8 /100 | #190 | Fair 12.1% |
| Swedes | 34.4 /100 | #191 | Fair 12.1% |
| Norwegians | 33.2 /100 | #192 | Fair 12.1% |
| Immigrants | Thailand | 32.5 /100 | #193 | Fair 12.1% |
| Immigrants | Eritrea | 31.9 /100 | #194 | Fair 12.1% |
| Immigrants | England | 31.4 /100 | #195 | Fair 12.1% |