Paiute vs Cree Single Father Households
COMPARE
Paiute
Cree
Single Father Households
Single Father Households Comparison
Paiute
Cree
3.3%
SINGLE FATHER HOUSEHOLDS
0.0/ 100
METRIC RATING
336th/ 347
METRIC RANK
2.8%
SINGLE FATHER HOUSEHOLDS
0.0/ 100
METRIC RATING
298th/ 347
METRIC RANK
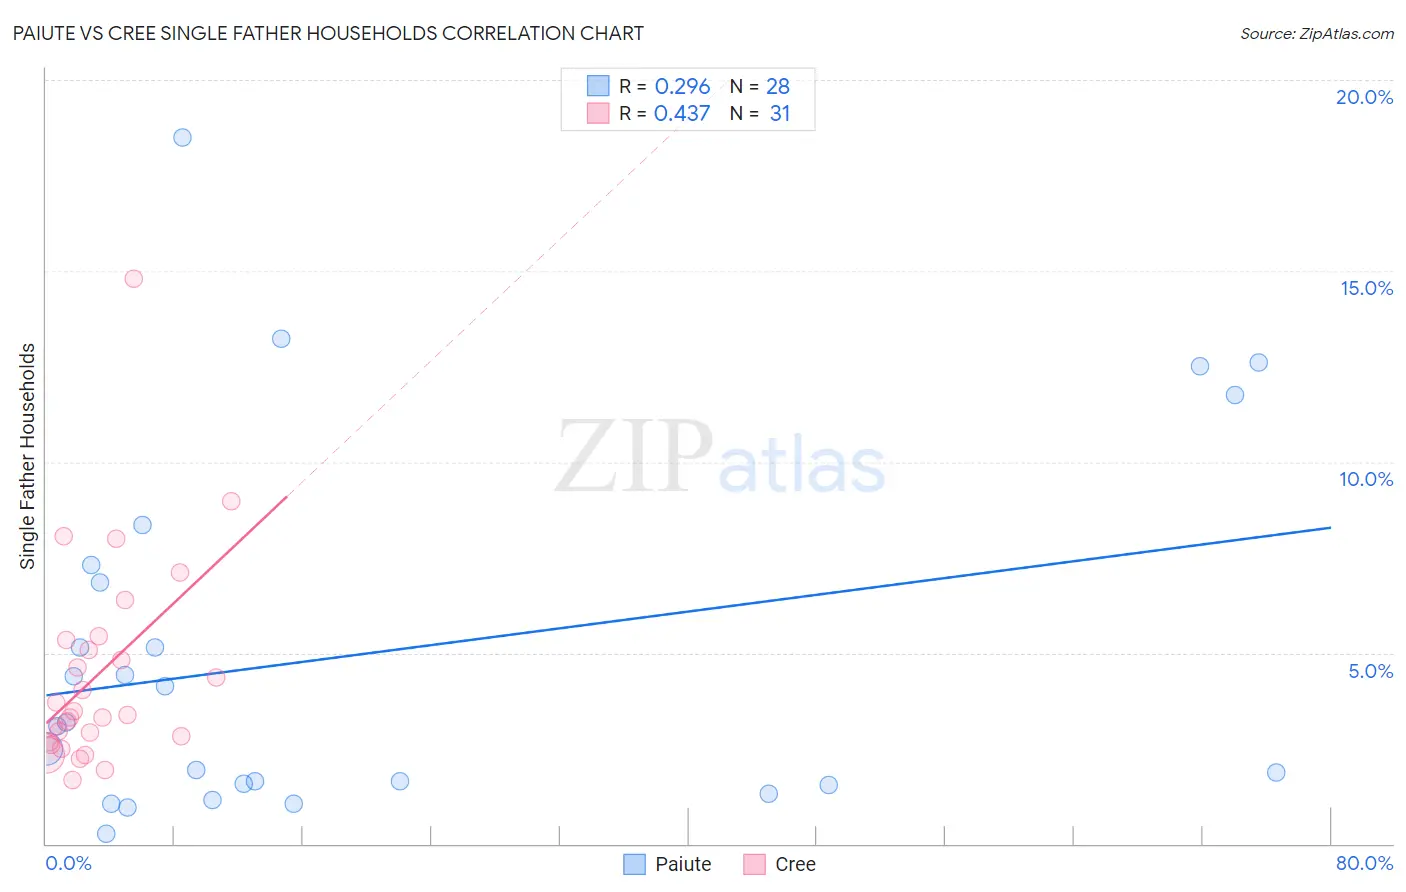
Paiute vs Cree Single Father Households Correlation Chart
The statistical analysis conducted on geographies consisting of 58,300,881 people shows a weak positive correlation between the proportion of Paiute and percentage of single father households in the United States with a correlation coefficient (R) of 0.296 and weighted average of 3.3%. Similarly, the statistical analysis conducted on geographies consisting of 76,112,534 people shows a moderate positive correlation between the proportion of Cree and percentage of single father households in the United States with a correlation coefficient (R) of 0.437 and weighted average of 2.8%, a difference of 19.1%.
Single Father Households Correlation Summary
| Measurement | Paiute | Cree |
| Minimum | 0.27% | 1.7% |
| Maximum | 18.5% | 14.8% |
| Range | 18.2% | 13.1% |
| Mean | 5.0% | 4.4% |
| Median | 3.1% | 3.4% |
| Interquartile 25% (IQ1) | 1.6% | 2.7% |
| Interquartile 75% (IQ3) | 7.1% | 5.3% |
| Interquartile Range (IQR) | 5.5% | 2.7% |
| Standard Deviation (Sample) | 4.7% | 2.7% |
| Standard Deviation (Population) | 4.7% | 2.7% |
Similar Demographics by Single Father Households
Demographics Similar to Paiute by Single Father Households
In terms of single father households, the demographic groups most similar to Paiute are Colville (3.3%, a difference of 0.030%), Yuman (3.3%, a difference of 0.050%), Pueblo (3.3%, a difference of 0.26%), Sioux (3.3%, a difference of 0.94%), and Alaskan Athabascan (3.4%, a difference of 2.4%).
| Demographics | Rating | Rank | Single Father Households |
| Chippewa | 0.0 /100 | #329 | Tragic 3.1% |
| Nepalese | 0.0 /100 | #330 | Tragic 3.1% |
| Navajo | 0.0 /100 | #331 | Tragic 3.2% |
| Yaqui | 0.0 /100 | #332 | Tragic 3.2% |
| Natives/Alaskans | 0.0 /100 | #333 | Tragic 3.2% |
| Yuman | 0.0 /100 | #334 | Tragic 3.3% |
| Colville | 0.0 /100 | #335 | Tragic 3.3% |
| Paiute | 0.0 /100 | #336 | Tragic 3.3% |
| Pueblo | 0.0 /100 | #337 | Tragic 3.3% |
| Sioux | 0.0 /100 | #338 | Tragic 3.3% |
| Alaskan Athabascans | 0.0 /100 | #339 | Tragic 3.4% |
| Alaska Natives | 0.0 /100 | #340 | Tragic 3.5% |
| Crow | 0.0 /100 | #341 | Tragic 3.5% |
| Tohono O'odham | 0.0 /100 | #342 | Tragic 3.8% |
| Pima | 0.0 /100 | #343 | Tragic 4.2% |
Demographics Similar to Cree by Single Father Households
In terms of single father households, the demographic groups most similar to Cree are Lumbee (2.8%, a difference of 0.38%), Honduran (2.8%, a difference of 0.49%), Japanese (2.8%, a difference of 0.57%), Chickasaw (2.8%, a difference of 0.59%), and Kiowa (2.8%, a difference of 0.77%).
| Demographics | Rating | Rank | Single Father Households |
| Blackfeet | 0.0 /100 | #291 | Tragic 2.7% |
| Choctaw | 0.0 /100 | #292 | Tragic 2.7% |
| Immigrants | Fiji | 0.0 /100 | #293 | Tragic 2.7% |
| Malaysians | 0.0 /100 | #294 | Tragic 2.7% |
| Chickasaw | 0.0 /100 | #295 | Tragic 2.8% |
| Japanese | 0.0 /100 | #296 | Tragic 2.8% |
| Hondurans | 0.0 /100 | #297 | Tragic 2.8% |
| Cree | 0.0 /100 | #298 | Tragic 2.8% |
| Lumbee | 0.0 /100 | #299 | Tragic 2.8% |
| Kiowa | 0.0 /100 | #300 | Tragic 2.8% |
| Immigrants | Latin America | 0.0 /100 | #301 | Tragic 2.8% |
| Spanish Americans | 0.0 /100 | #302 | Tragic 2.8% |
| Immigrants | Honduras | 0.0 /100 | #303 | Tragic 2.8% |
| Mexican American Indians | 0.0 /100 | #304 | Tragic 2.8% |
| Hispanics or Latinos | 0.0 /100 | #305 | Tragic 2.8% |